After 3 Years with Feishu Docs Multi-Dimensional Tables, Here’s My Ultimate Beginner’s Guide

The Debt Finally Paid Off

Today marks a milestone — the long-awaited Feishu (Lark) Multi-dimensional Spreadsheet tutorial is finally published.
It took me an entire month to deliver — a commitment I made weeks ago and can now finally consider settled.
---
Background Story
It all started when Azhen posted about Feishu Multi-dimensional Spreadsheets.
One of her followers asked:
> "What exactly are they? Is there a complete 'beginner to expert' tutorial?"

Someone jokingly replied:
> "I have a tutorial from beginner… to giving up."

I laughed out loud.
Then, without much thought — perhaps as motivation or just an impulse — I commented:
> “I’ll write one…”

To my surprise, people actually started waiting for it — and even followed up to remind me.

---
Why I’m Writing This Guide
I’ve always wanted to write about Feishu Multi-dimensional Spreadsheets. Not because I’m an Excel expert — I’m not — but because Feishu’s system has become the core of my daily operations.
Over time, I discovered we could represent entire departmental systems in a single multi-dimensional spreadsheet — from business and operations to content creation.
Some examples from our company include:
- Idea selection sheets
- Content data statistics sheets
- Project progress trackers
- Collaboration sheets for single projects
- Influencer rate cards

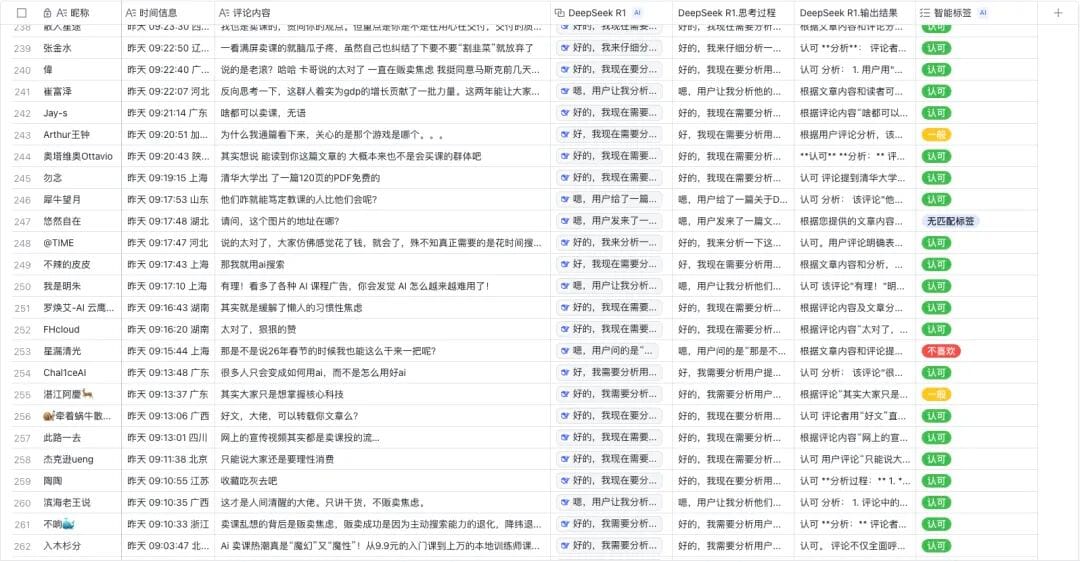
Creative uses extend even further — for example, I once used Feishu Multi-dimensional Spreadsheets to analyze my comment section.
You don’t need to know complex Excel formulas or have a background in data analysis — if you’re willing to explore, you’ll learn quickly.
That’s why I recommend Feishu Multi-dimensional Spreadsheets wholeheartedly, even though Feishu hasn’t paid me a cent.
For beginners puzzled by Excel or overwhelmed by BI dashboards, Feishu offers a fast, comfortable entry point.
Today, I’m sharing my babysitter-level beginner’s guide, distilled from three years of hands-on use.
The guide is divided into three main sections.
---
1. What is Feishu Multi-dimensional Spreadsheet?
Most people think of Excel first when it comes to spreadsheets. But Feishu’s offering is fundamentally different — it’s more of a database than a spreadsheet.
Why This Matters
Our work involves constant interaction with data — from small daily customer records to large aggregated OKRs and thousands of projects.
We need:
- Data storage
- Structured organization
- An effortless way to analyze and act upon it
Feishu addresses these needs by splitting its functionality into input and output.
---
Input
Unlike Excel’s free-form cell entry, Feishu structures data by rows + fields.
- Row: a single record
- Field: a column defining attributes of that record
Example:
In an article data table, the row might be “Deepseek sold for 9.9 RMB on Taobao”, while fields record metrics like reads, likes, shares, etc.
Combined, these form a database displayed in spreadsheet form.
Feishu’s capacity:
- Up to 10 million rows per base
- 1,000 users editing simultaneously online
- Field-level permission control
---
Output
Feishu Base can generate real-time Views and Dashboards from stored data.
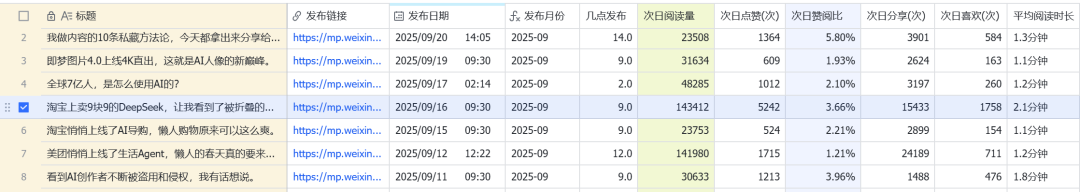
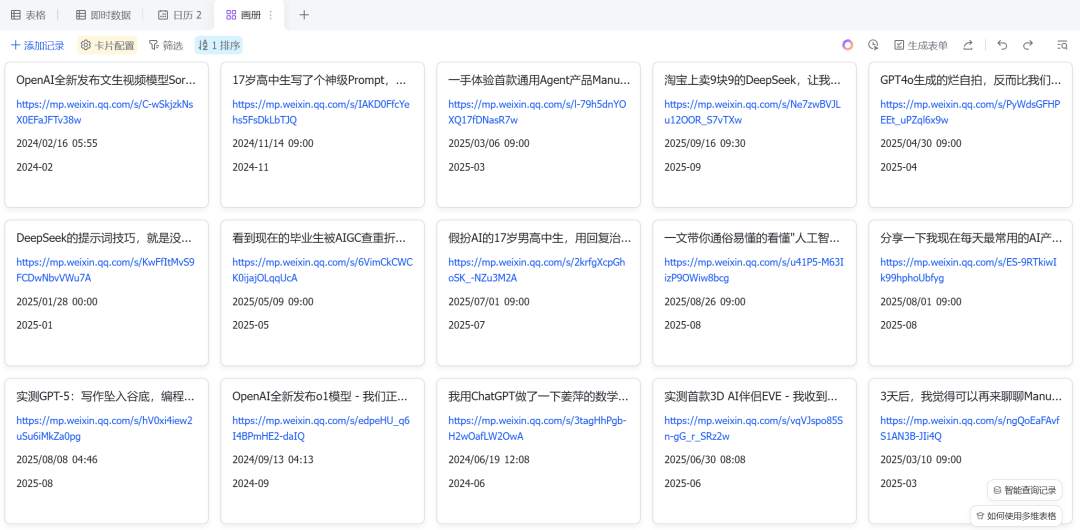
Example View — gallery sorted by likes:
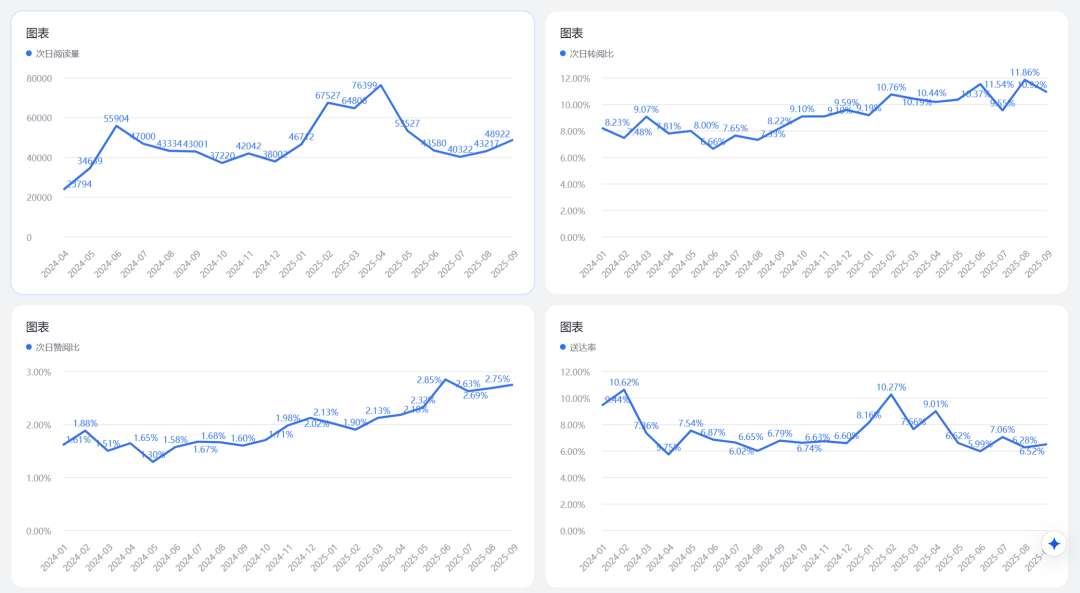
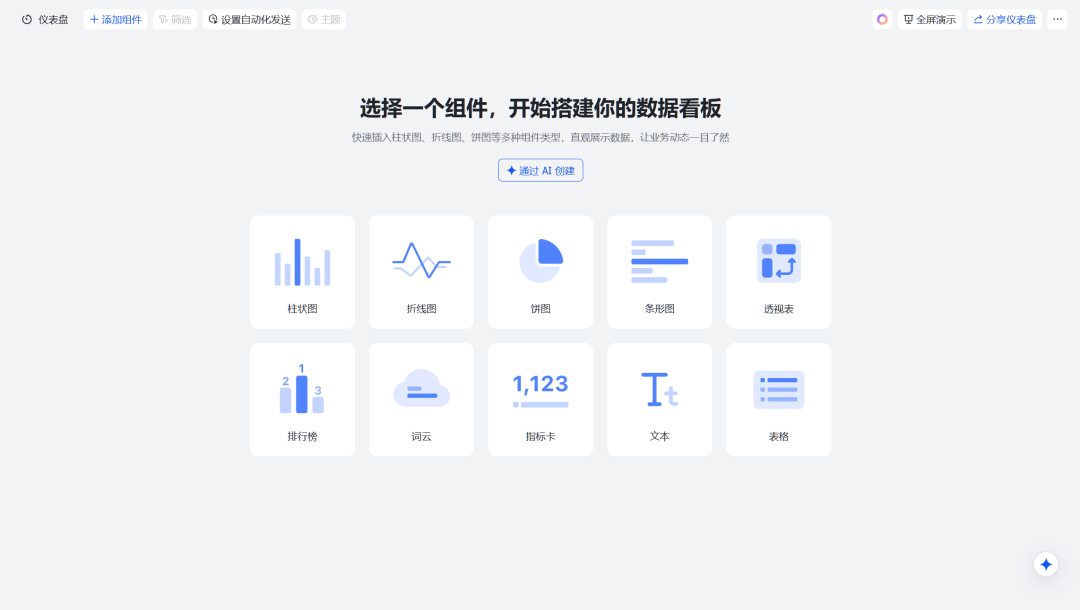
Example Dashboard — visual charts for quick performance review:
Both update automatically when data changes.
Feishu also supports:
- AI-powered formula generation
- AI translation within fields
- AI autofill
- AI image generation
This turns a table into a field-driven batch production system.
Two ways to see Feishu Base:
- Database with spreadsheet UI — letting non-experts manage data naturally.
- Field-based workflow system with built-in AI — enabling batch generation and automation.
---
2. How to Use Feishu Base

Feishu Base is independent from the main Feishu suite. You can use it online:
Website: https://base.feishu.cn/
Steps:
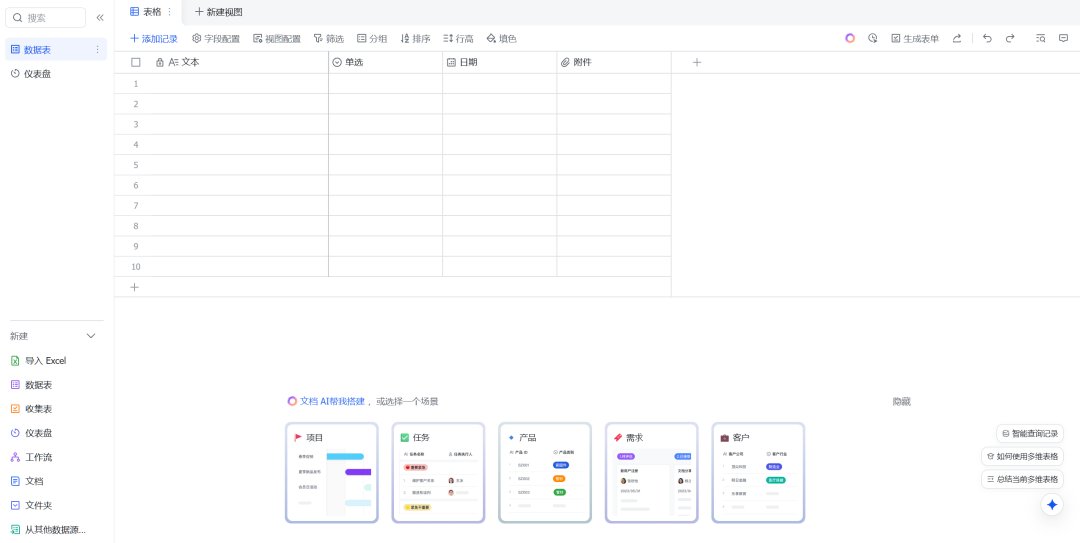
- Register an account.
- Click “Create New Base” to get your first table.
---
Core Concepts to Master
- Fields
- Field Shortcuts
- Views & Dashboards
- Workflows & Automation
- Permissions
---
1. Fields
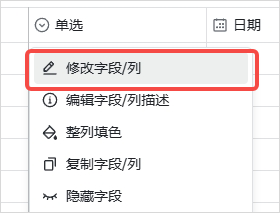
- Title: Field name
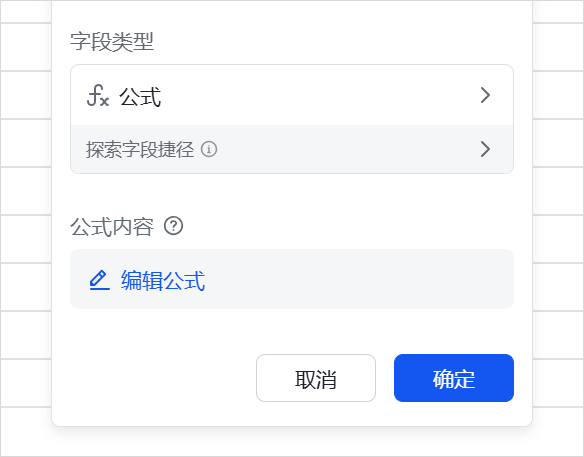
- Field Type: Kind of data (text, number, attachment, date, etc.)
Field Type Categories:
- Information Entry: Text, attachment, number, date, phone, email, hyperlink, progress, rating, single/multi-select
- Collaboration: Person, group — assign or track
- Data Linking: One-way/two-way links, lookup references
- Automation: Auto-number, button
- Data Tracking: Created/modified by, timestamps
- Formula Calculation: Manual or AI-assisted formulas
AI formula generation example:
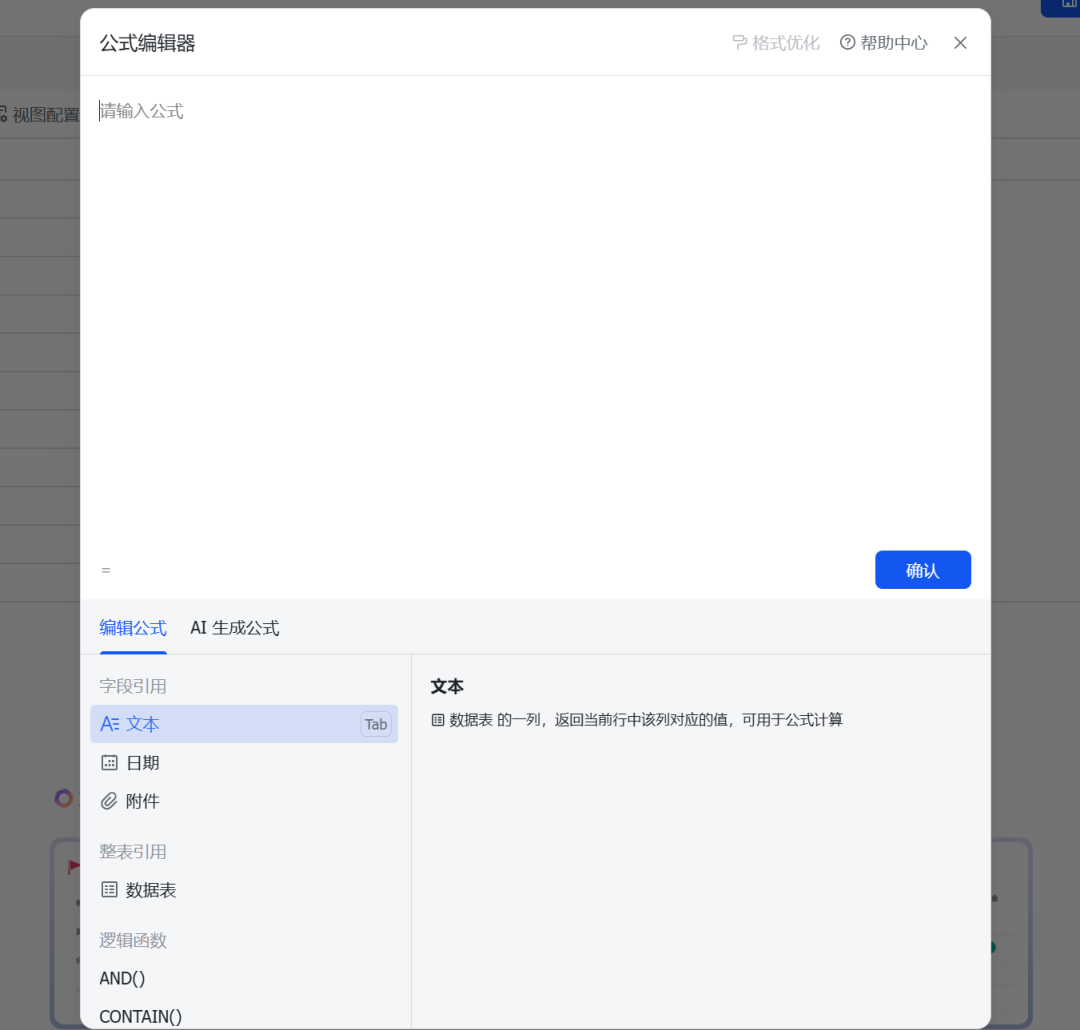
Benefits: Real-time automatic recalculation with new data.
---
2. Field Shortcuts
Field shortcuts offer packaged complex functions.
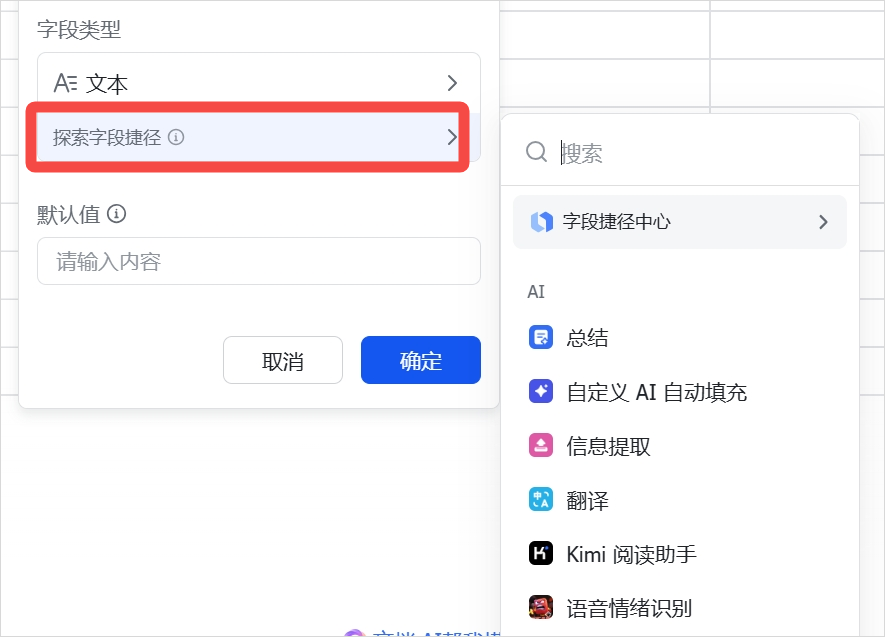
AI-integrated shortcuts can:
- Generate text, images, videos
- Read web links
- Produce PPT or Markdown
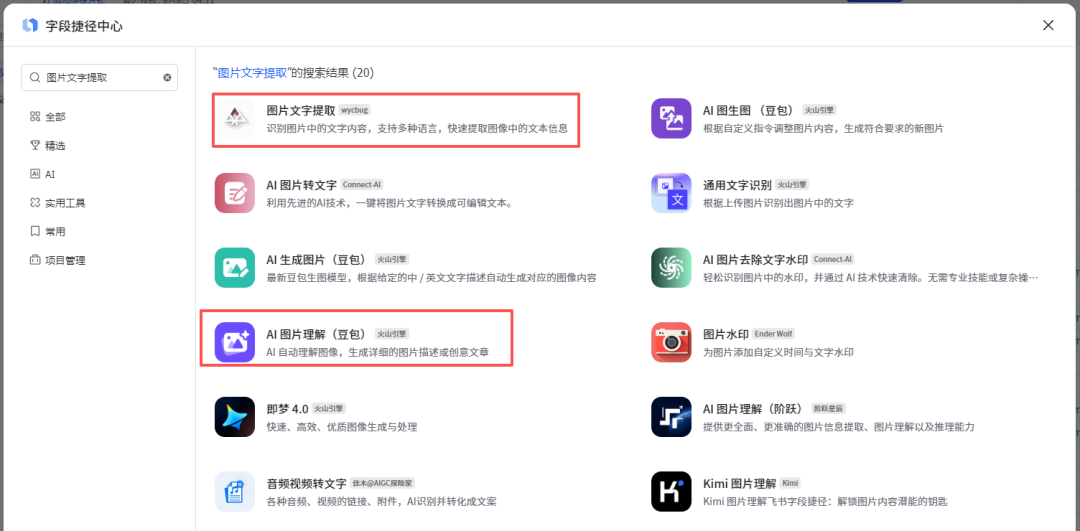
- Extract data from images via OCR
Example: Batch OCR processing of scanned docs:

---
3. Views & Dashboards
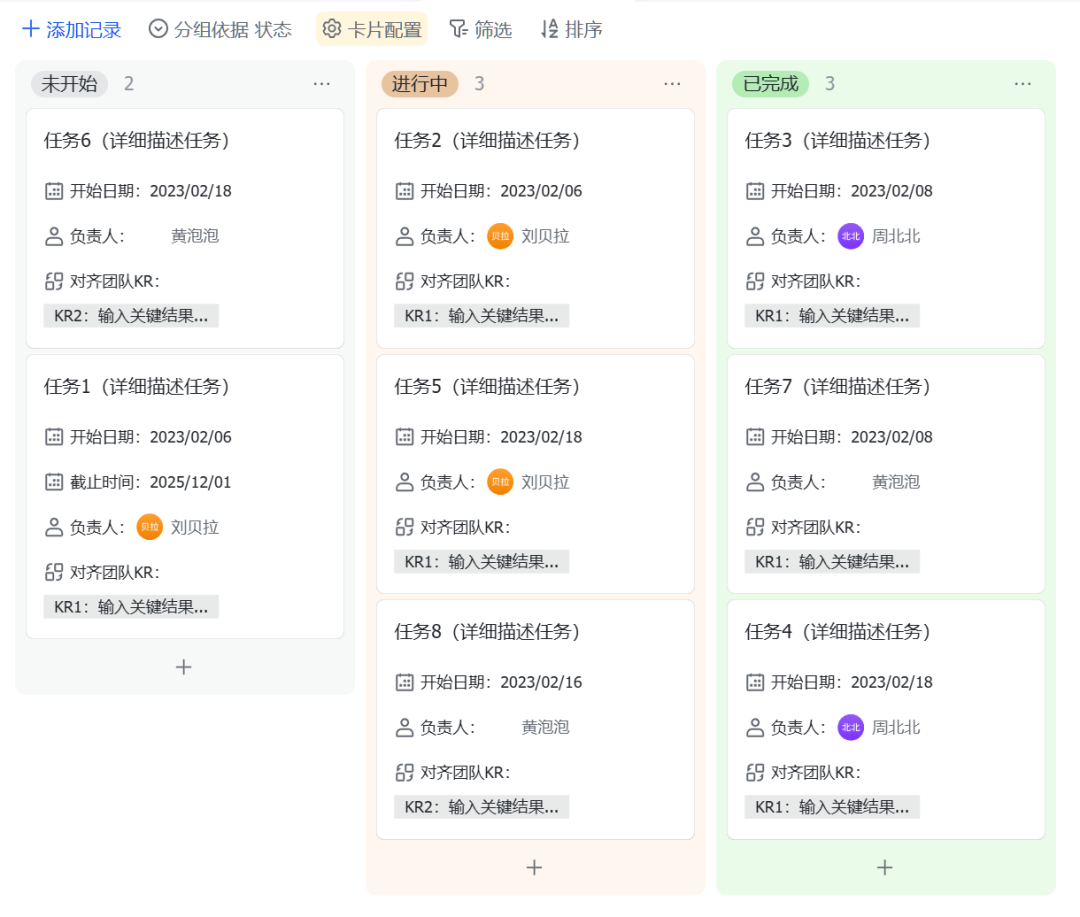
Views: Six types including Kanban for progress tracking.
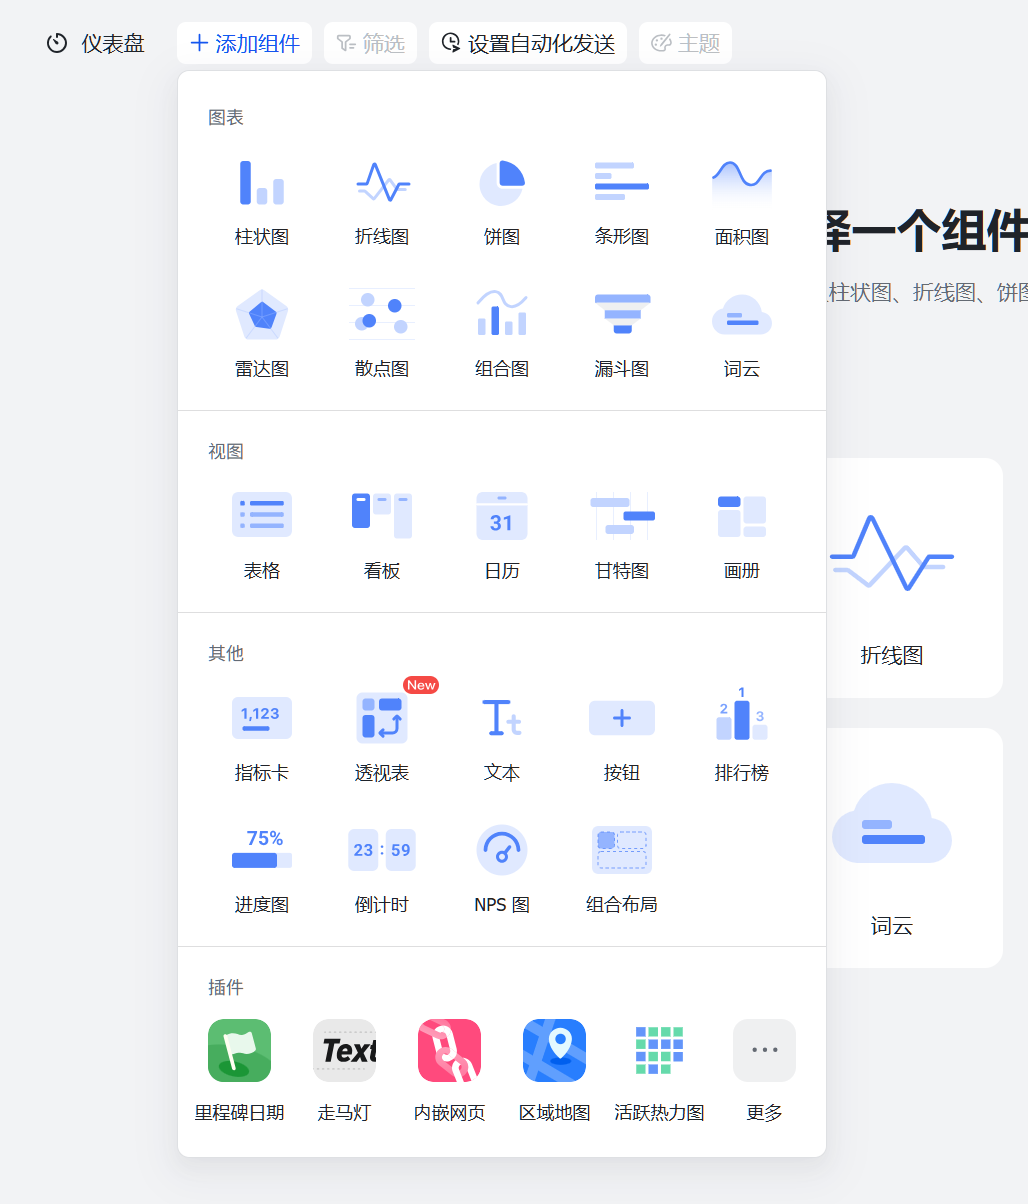
Dashboards: AI can build them in one click.
Customizable — add components, chart types, and plugins.
---
4. Automation & Workflows
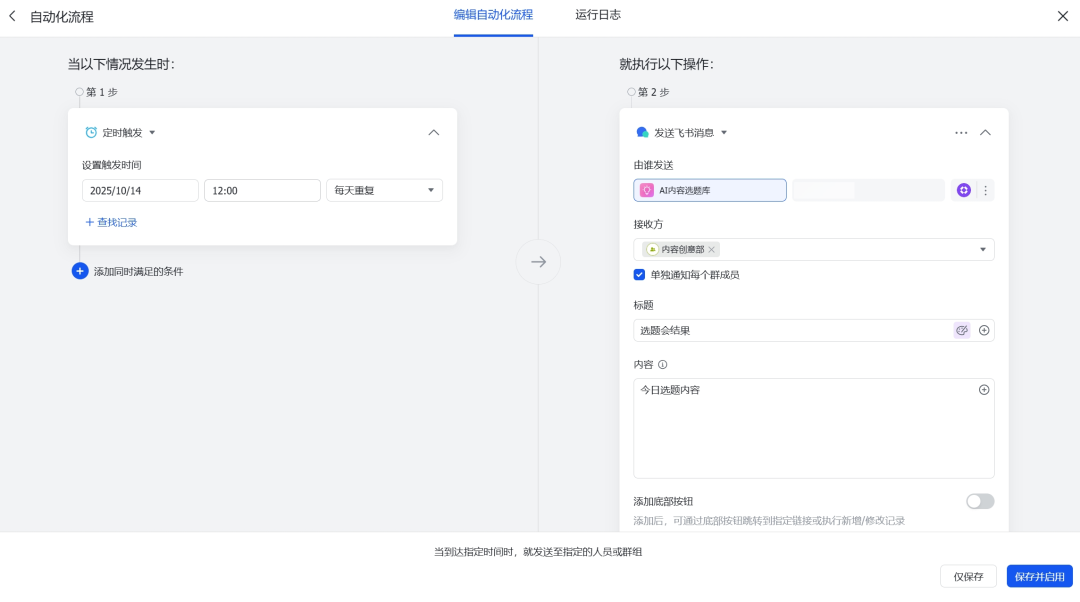
Automation: Triggered events in your table (e.g., send messages after meetings).
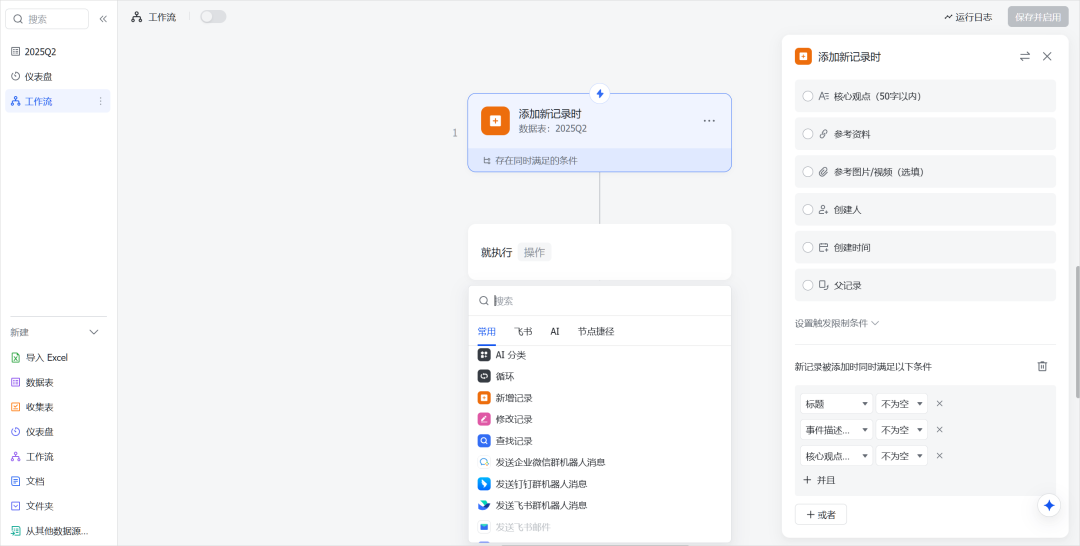
Workflows: More complex, appear in left sidebar — allow auto-categorization, notifications, etc.
---
5. Permissions

- Control access by roles or field-specific visibility.
- Field-level permissions mean a single master table can support multiple scenarios securely.
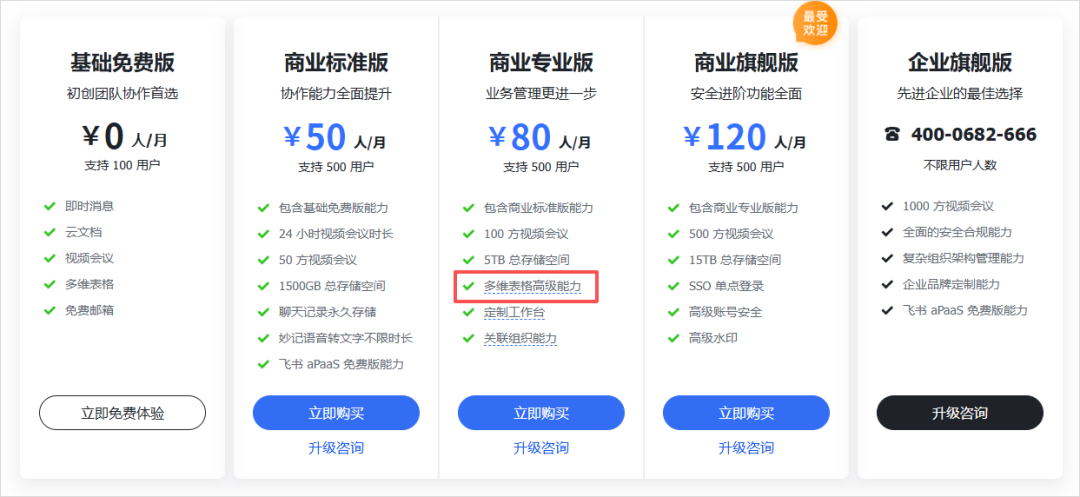
Note: Advanced permissions are a paid feature.
---
3. What You Can Do with Feishu Base
---
Example: Data Analysis
I use a scheduled crawler to pull daily metrics from my WeChat Official Account into a table.
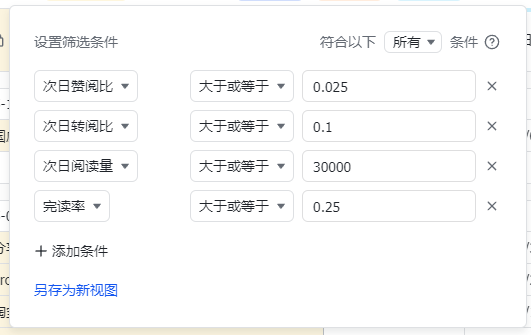
Key Metrics:
- Reads ≥ 30,000
- Like-to-read ratio ≥ 2.5%
- Share-to-read ratio ≥ 10%
- Completion rate ≥ 25%
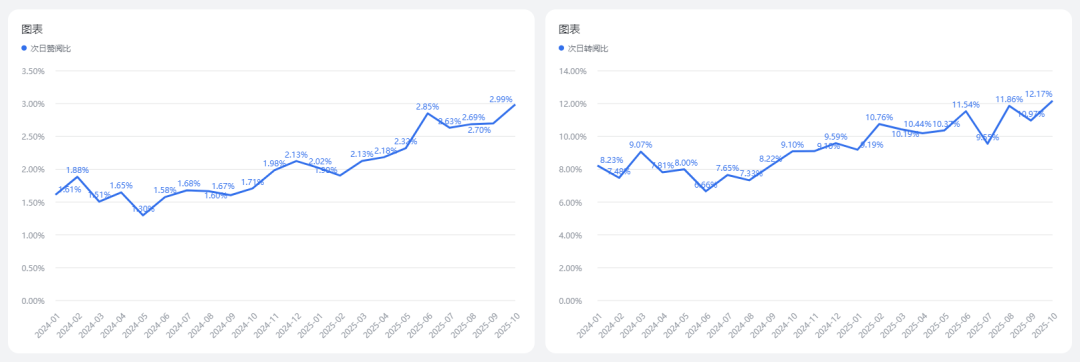
Tracking trends in these metrics has helped me measure and improve content quality, verified by dashboards.
---
Example: Project Management
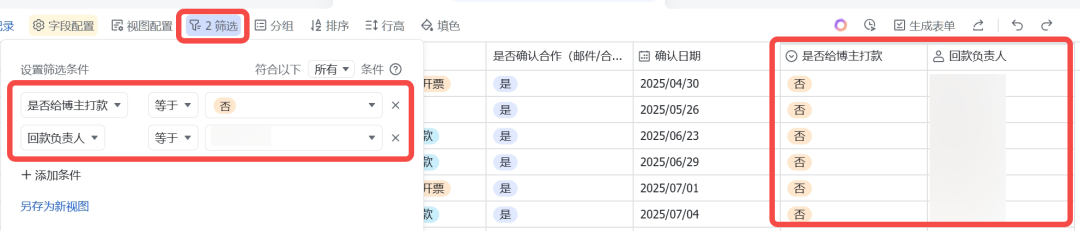
Our internal table has over 40 fields, consolidating client, project, influencer, and payment data.
With filters, I can instantly find unpaid projects assigned to a teammate:
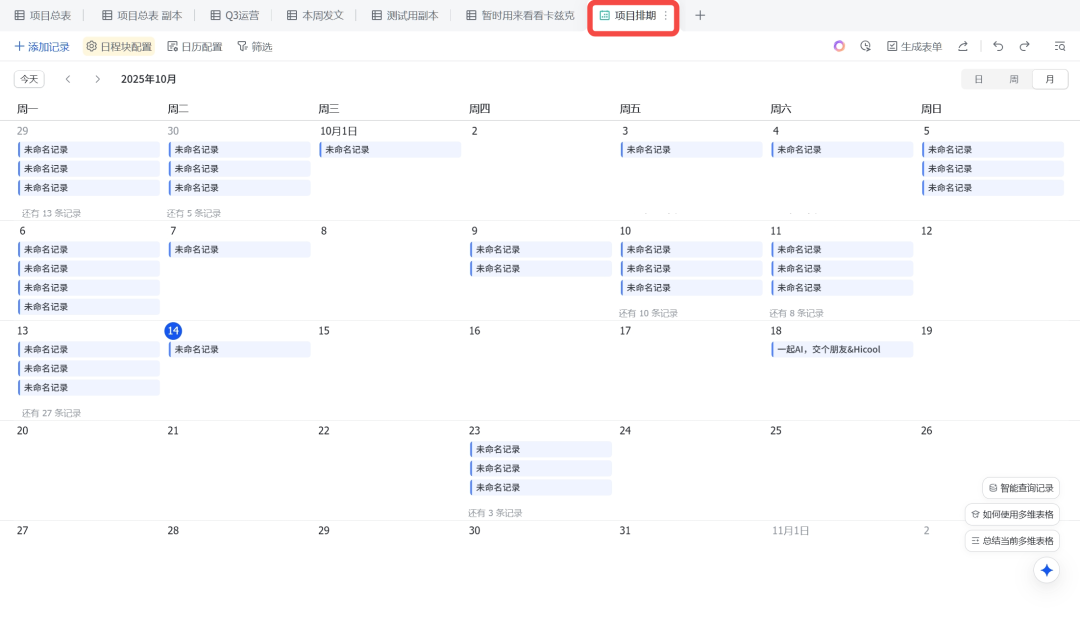
View modes like Calendar View offer scheduling clarity:
---
Example: Workflow Setup
One creative workflow:
- Double-tap the phone’s back to send copied text via Webhook
- Bot inserts it into a Feishu table
- AI shortcut automatically generates an image
Result: Instant creative brainstorming.
---
Final Takeaways
- Feishu Multi-dimensional Tables combine database power with spreadsheet familiarity.
- AI integration enables low-cost automation and batch creation workflows.
- Productivity gains: at least 3–5x higher for teams using them versus those who don’t.
I often joke that I’m Feishu’s No.1 unpaid ambassador — but I mean it when I say this tool can make your organization stronger and more agile.
---
If you found this guide useful, please like, follow, and share.
If you want instant updates, consider giving me a ⭐.
---
Do you want me to prepare a concise cheat sheet version of this tutorial so you can review it at a glance? That way, you'll have both the full detailed guide and a quick-reference format.