Analyze and Grow with Twitter Follower Stats
Learn to access, analyze, and leverage Twitter follower stats to boost engagement, tailor content, and drive consistent audience growth.

Analyze and Grow with Twitter Follower Stats
Twitter has become a powerhouse for brand visibility and audience engagement. If you want measurable results, tracking and interpreting Twitter follower stats is essential. These analytics go beyond follower counts to reveal trends, behaviors, and opportunities to refine your content strategy, boost engagement, and accelerate brand growth.

This comprehensive guide explains what follower stats entail, how to access them, and actionable ways to turn data into strategies that drive consistent audience expansion.
---
Understanding What Twitter Follower Stats Include
Follower stats include multiple data points that shed light on who your audience is and how they interact with your tweets. Key metrics to monitor:
- Demographics: Age, gender, language, and other identity markers.
- Growth trends: Daily, weekly, or monthly follower changes.
- Engagement rates: Likes, retweets, replies, and profile clicks.
These metrics inform both the quantity and quality of your Twitter audience, helping you craft targeted messaging.
---
Accessing Twitter Follower Stats
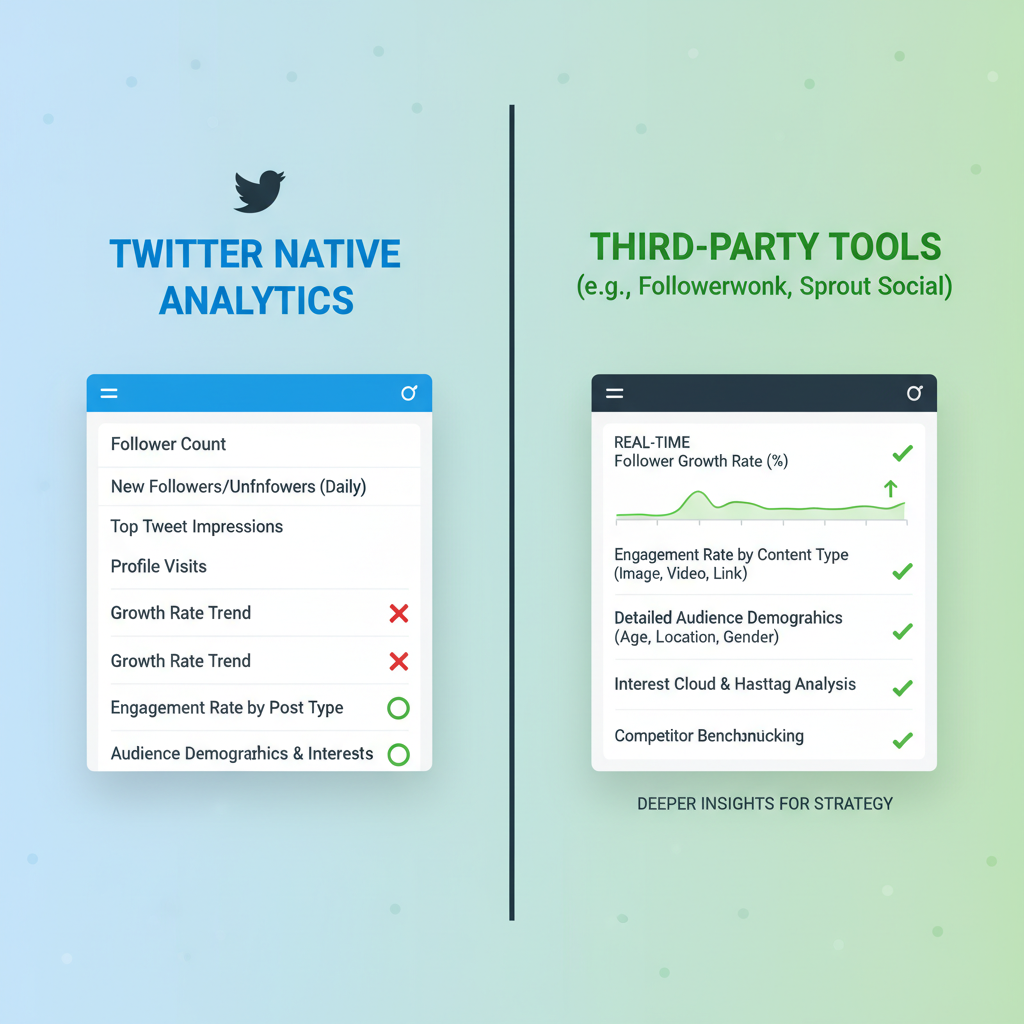
Using Twitter Analytics
Twitter’s free analytics dashboard offers granular insights:
- Log in to Twitter.
- Navigate to More → Analytics.
- Select the Audience tab for segment breakdowns.
Here, you’ll view interests, locations, activity patterns, and engagement metrics.
Third-Party Tools
External tools provide deeper analyses and extended historical data:
- Hootsuite Analytics: Tracks multiple social networks.
- Followerwonk: Enables advanced audience segmentation.
- Sprout Social: Offers detailed engagement and reporting capabilities.
They often allow filtering beyond what Twitter’s native analytics support.

---
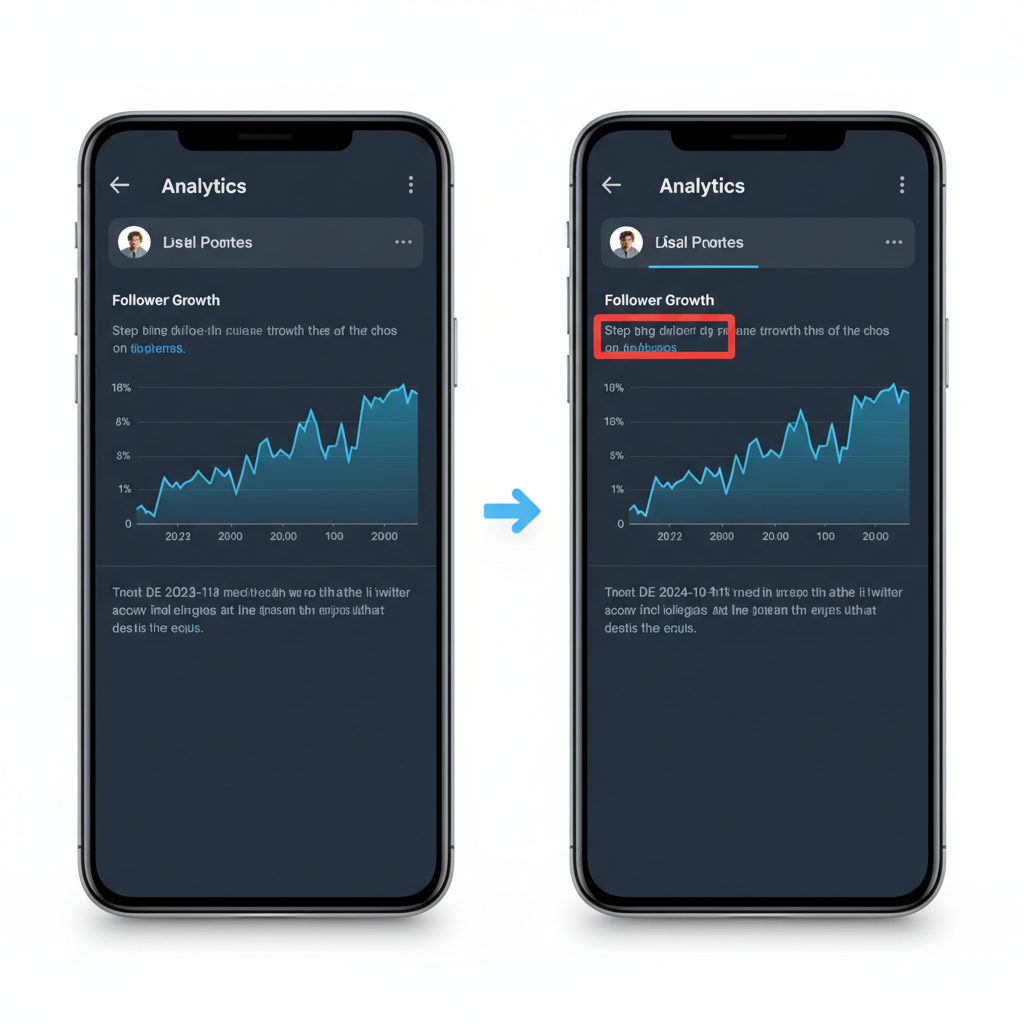
Analyzing Your Follower Growth Rate Over Time
Tracking growth rate over time highlights momentum. Use:
Growth Rate (%) = ((New Followers in Period) / (Starting Followers)) * 100Monitor spikes and dips over months or quarters. Correlate spikes to campaign dates to identify high-performing strategies.
---
Reviewing Location, Interests, and Activity Hours
Location
Localize content for geography-specific promotions and events.
Interests
Create tweets aligned with top audience interests to increase relevance.
Activity Hours
Post during peak activity windows for maximum visibility and interaction.
---
Tracking Follower Engagement Metrics
Engagement reveals how invested followers are:
- Likes: Content appeal indicator.
- Retweets: Organic reach booster.
- Replies: Direct audience conversations.
- Link Clicks: Conversion potential metric.
Formula:
Engagement Rate (%) = (Total Engagements / Total Impressions) * 100Higher engagement frequently leads to accelerated organic growth.
---
Comparing Organic vs Promoted Growth
Separating growth types clarifies ROI:
| Growth Type | Description | Advantages | Considerations |
|---|---|---|---|
| Organic | Follows gained via ongoing tweets, interactions, and mentions. | Free; builds authenticity. | Slower pace in competitive sectors. |
| Promoted | Follows via paid Twitter Ads campaigns. | Quick, targeted audience building. | Requires budget; low ROI possible if not targeted well. |
---
Segmenting Followers by Type
Categorizing followers into groups (e.g., influencers, customers, partners) lets you customize outreach and prioritize relationship-building for marketing impact.
---
Identifying Content Types Driving New Followers
Pinpoint tweets causing follower surges:
- Visuals: Strong images or infographics.
- Threads: Multi-tweet series with valuable insights.
- Data-driven posts: Unique statistics or studies.
- Trending coverage: Timely event commentary.
Use analytics or third-party tools to map content to follower acquisition.

---
Refining Posting Schedule and Hashtags
Leverage engagement data to fine-tune timing and hashtag strategies.
Frequency:
- Post 3–5 quality tweets daily for consistency.
Hashtags:
- Identify high-engagement hashtags. Experiment for optimal reach.
---
Measuring Campaign Impact on Growth
Set clear measurement intervals and benchmark before, during, and after campaigns to calculate ROI.
Track:
- Follower changes
- Engagement spikes
- Reach expansion
---
Running A/B Tests on Profile and Tweets
Profile:
- Compare different bios or images to see which garners more follows.
Tweets:
- Test formats (image vs text) and tones (formal vs casual).
Let tests run long enough for reliable results.
---
Benchmarking Against Competitors
Analyze competitors’ frequency, themes, and engagement-to-follower ratios to refine your own growth tactics.
---
Setting KPIs and Monthly Monitoring
Track key indicators for continuous improvement:
- Monthly growth rate
- Engagement rate
- Click conversion
Review monthly to stay aligned with goals.
Example KPI Table
| KPI | Target | Current | Status |
|---|---|---|---|
| Follower Growth Rate | 5% / month | 4.2% | Below target |
| Engagement Rate | 3% | 3.4% | Above target |
| Click Conversion Rate | 1.5% | 1.3% | Below target |
---
Summary
Incorporating Twitter follower stats into your marketing plan turns raw data into actionable intelligence. By understanding your audience, tracking engagement, and aligning growth patterns with targeted content, you’ll amplify your Twitter presence and ROI.
Start analyzing today—your next big audience surge could be just one strategic tweet away.


