Analyze Post Statistics to Improve Social Media Engagement
Learn how to analyze social media post statistics, track key metrics, and interpret trends to boost engagement and achieve marketing goals.

Understanding Post Statistics and Why They Matter
In the fast-paced world of social media marketing, post statistics are the compass that guides your content strategy. These valuable data points reveal how your audience interacts with your posts and enable you to make data-driven decisions rather than relying on guesswork. Mastering post statistics is essential for optimizing performance, boosting engagement, and increasing ROI from your content efforts.
Post statistics matter because they highlight:
- Which content resonates most with your followers.
- How effectively you’re reaching new audiences.
- Which posts contribute most to business objectives (brand awareness, lead generation, sales).
By consistently monitoring your statistics, you can identify trends, avoid stagnation, and maintain growth in engagement and conversions.
---
Identifying Key Metrics to Track
It’s not enough to collect data—you must know which key metrics truly matter and understand their relevance to your goals. This ensures your analysis translates into actionable insights.
Core Social Media Metrics
Here are some of the most important metrics for analyzing post performance:
| Metric | Definition | Why It Matters |
|---|---|---|
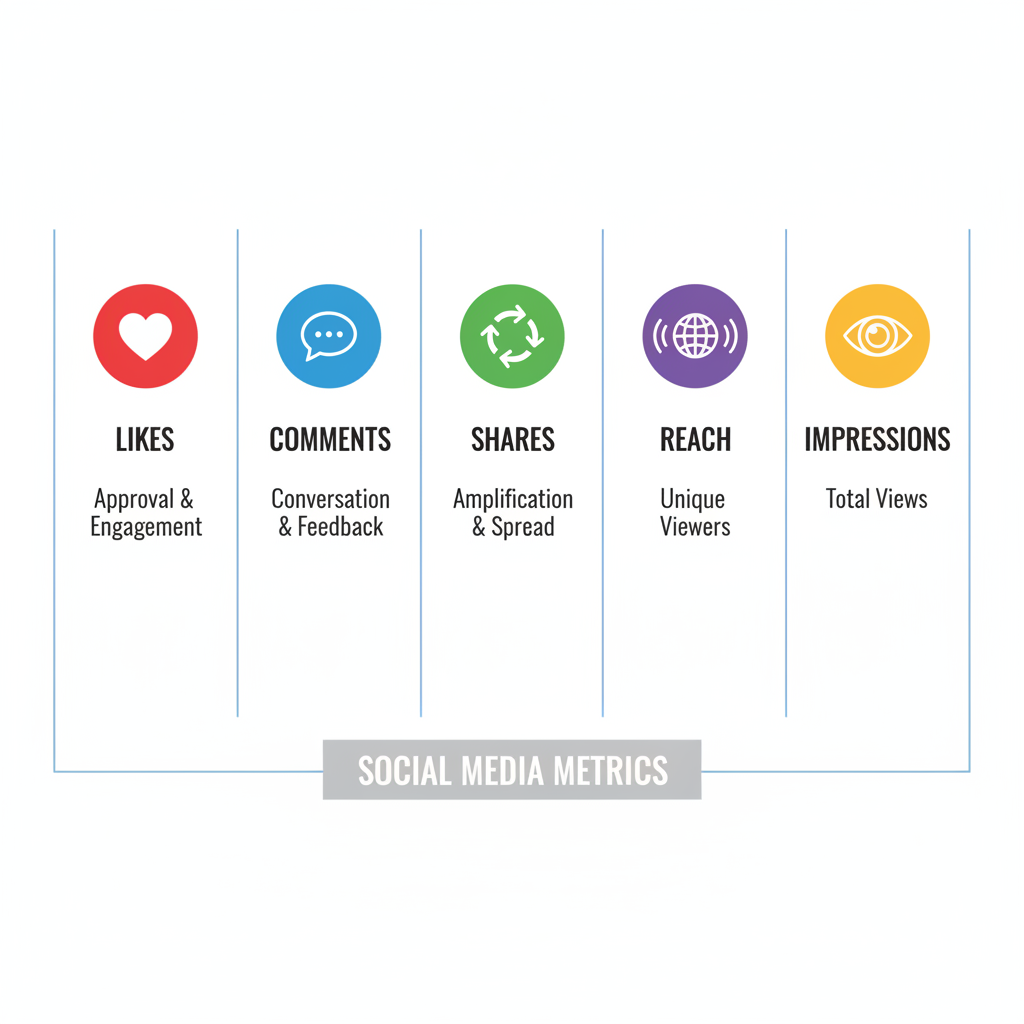
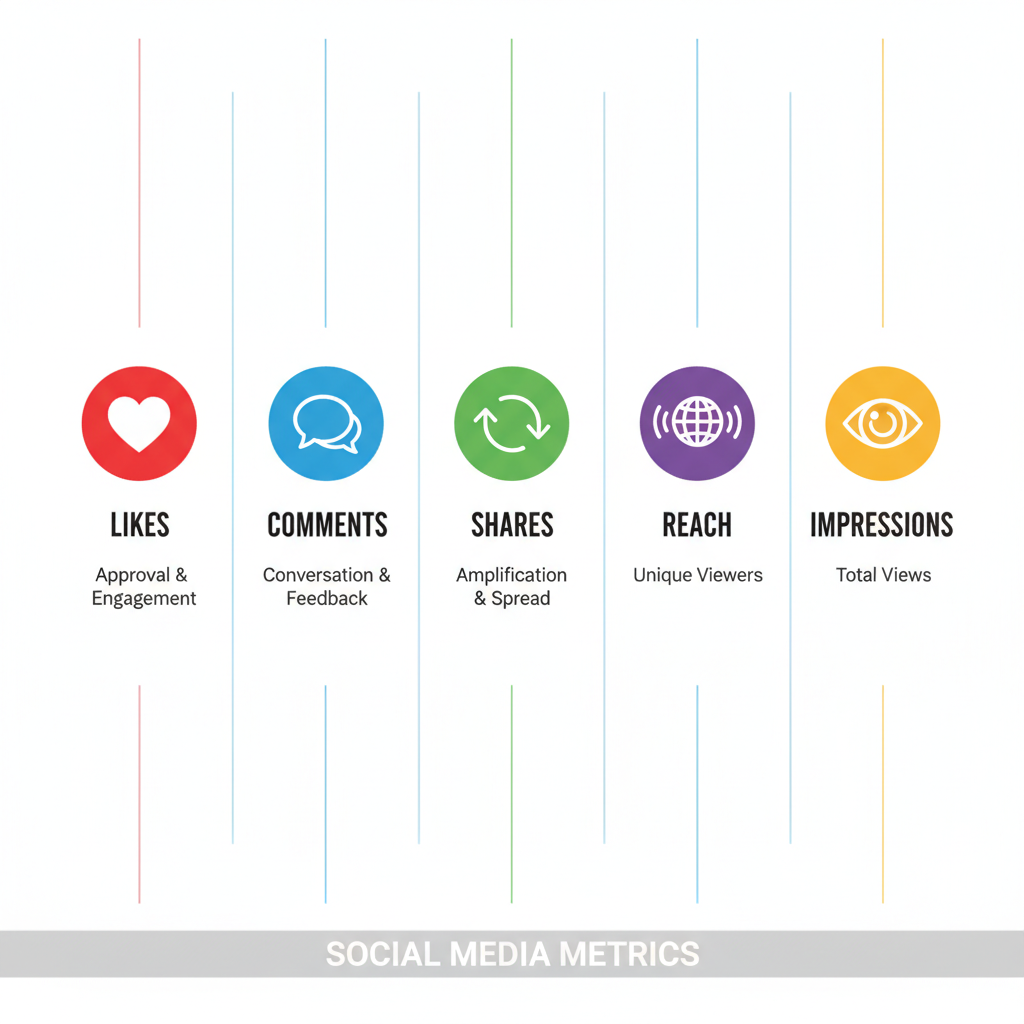
| Impressions | Total times your post appeared to users. | Measures potential visibility. |
| Reach | Unique users who saw your post. | Indicates audience size exposure. |
| Engagement Rate | Likes, comments, shares divided by reach/impressions. | Measures audience interaction quality. |
| Shares | Number of times users shared your post. | Expands organic reach and credibility. |
| Saves | Times users saved your post for later. | Signals valuable or evergreen content. |
---
Setting Clear Goals Before Tracking Statistics
Before diving into analytics dashboards, define your primary social media objectives. This clarity ensures you interpret metrics in proper context.
Possible goals include:
- Brand Awareness → Focus on reach and impressions.
- Conversions → Prioritize engagement leading to clicks or purchases.
- Community Building → Track comments, shares, and sentiment.
By knowing what you aim to achieve, you filter out noise and focus on metrics that drive tangible business growth.
---
Utilizing Native Analytics Tools
Every major social network provides native analytics features to track post statistics:
- Facebook Insights – View detailed metrics for page posts, stories, and videos.
- Instagram Insights – Access reach, saves, shares, and profile activity.
- Twitter/X Analytics – Monitor tweet impressions, engagement, and follower interests.
- LinkedIn Analytics – Track engagement rates, click-through rates, and demographics.
These built-in tools are free, updated in real-time, and ideal starting points for measuring post performance before investing in third-party platforms.
---
Segmenting Data by Content Type
Not all posts perform equally—format impacts engagement. Break down metrics by content types:
- Photo → Static imagery; effective for quotes or infographics.
- Video → High engagement potential via storytelling and dynamic visuals.
- Carousel → Popular on Instagram for educational or step-by-step content.
- Stories → Temporary but great for urgency and real-time updates.
- Live Sessions → Highly interactive, encouraging immediate participation.
This segmentation helps allocate resources toward the formats proven to work best.
---
Interpreting Trends Over Time
One post’s statistics can be misleading. Seasonal changes, external events, or platform algorithm updates can impact engagement. Regular tracking allows patterns to emerge:
- Consistent growth in engagement rate → audience loyalty.
- Sudden drops → potential algorithm changes or content fatigue.
- Spikes → alignment with special events or trending topics.
Trend analysis turns isolated data into long-term strategy.
---
Running A/B Tests for Optimization
Experimentation fuels improvement. Conduct A/B tests by posting variations with one change:
- Alter only one factor (caption style, hashtags, posting time).
- Measure engagement rates between versions.
- Apply winning elements to future posts.
This method ensures evolution based on factual audience behavior.
---
Leveraging Audience Demographics
Demographics reveal who is engaging with your posts. Data such as age, gender, location, and interests enable tailored strategies.
Example: If 70% of your audience is aged 18–24:
- Use trending language and pop culture references.
- Prioritize platforms popular with younger users.
- Focus on visually striking short-form videos.
---
Benchmarking Against Industry Standards
Compare post statistics to industry averages to gauge competitiveness. For example, if your engagement rate is 3% and the average is 5%, there’s clear room for improvement.
Benefits include:
- Setting realistic performance goals.
- Identifying areas for optimization.
- Aligning growth expectations with competitors.
---
Building a Monthly Reporting Template
A consistent reporting process keeps your team aligned:
Include:
- KPIs per goal (reach, impressions, engagement rate).
- Top 3 performing posts with details.
- Content type breakdown.
- Recommendations for next month.
Automating the template via spreadsheets or analytics tools saves time and provides consistent visibility.
---
Linking Performance Data to ROI
Engagement must be connected to business outcomes. Link post statistics to:
- Website visits.
- Lead form completions.
- Direct sales from campaigns.
Google Analytics and UTM codes are essential for tying social media actions to measurable revenue impact.
---
Refining Posting Schedules and Formats
Use data to determine optimal posting times and formats:
- Share reels during evening peak engagement.
- Schedule educational carousels during work hours for B2B audiences.
Strategic timing improves reach and interaction.
---
Monitoring Competitors’ Content Statistics
Competitive analysis can reveal inspiration and opportunities:
- Review publicly visible engagement metrics.
- Observe posting frequency.
- Note themes generating strong interaction.
Keeping an eye on competitors helps you adapt swiftly to trends.
---
Leveraging Third-Party Analytics Tools
Beyond native platforms, robust third-party tools offer deeper insights:
- Hootsuite Analytics
- Sprout Social
- Buffer Analyze
These consolidate KPIs in one dashboard, enabling advanced reporting and scheduling.
---
Creating Actionable Recommendations
To maximize data’s impact, conclude analysis with:
- Actions to replicate successes.
- Adjustments for underperformers.
- New ideas from trends and audience input.
Without implementation, insights remain theoretical and miss driving tangible results.
---
Summary and Next Steps
Post statistics are more than just numbers—they’re a critical decision-making tool for social media success. By tracking key metrics, setting defined goals, segmenting content types, and tying performance to ROI, you can refine your strategy and achieve meaningful business outcomes.
Take action now: Start building a monthly reporting template, run your first A/B test, and leverage both native and third-party tools to gain a full picture of your post statistics. The sooner you start, the sooner you’ll see measurable growth.