Analyze Facebook Page Free with Insights Tools
Learn how to use Facebook Page Insights and free tools to track engagement, reach, and audience data to improve your content and grow your page.
Analyze Facebook Page Free with Insights Tools
Analyzing your Facebook Page for free is both possible and powerful when you use Facebook Page Insights alongside compliant, no‑cost third‑party tools. This built‑in analytics platform lets you measure engagement, track reach, and understand your audience without paying for premium subscriptions. In this guide, you’ll learn how to analyze Facebook Page free step‑by‑step, so you can make smarter content decisions and grow without extra costs.
---
Understanding What Facebook Page Insights Offers for Free
Facebook Page Insights is an analytics dashboard available to every Page admin or editor. It’s accessible directly from your Page’s menu and aggregates valuable data such as:
- Page Likes and Follows
- Post reach (organic and paid)
- Engagement metrics (likes, comments, shares)
- Audience demographics
- Optimal posting times
Unlike many external tools, Insights offers these metrics free of charge, updated in near real‑time. This makes it ideal for ongoing monitoring without additional investment.
---
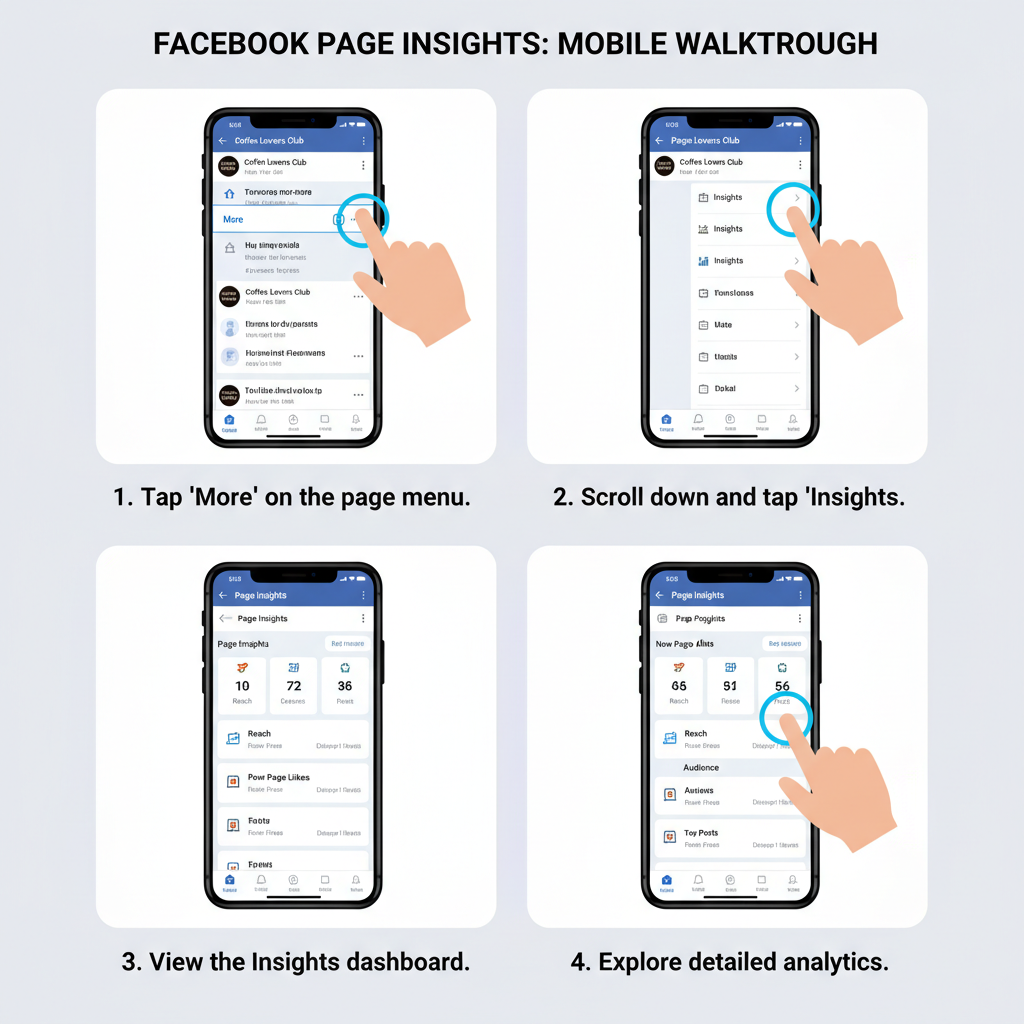
Navigating to the Insights Dashboard
To access Insights:
- Go to your Facebook Page.
- Click Professional dashboard or Insights from the left‑hand menu.
- The dashboard opens to the Overview tab by default.
Within the dashboard, you’ll find:
- Overview – high‑level performance summaries.
- Posts – content‑specific metrics.
- Audience – detailed demographic breakdowns.
---
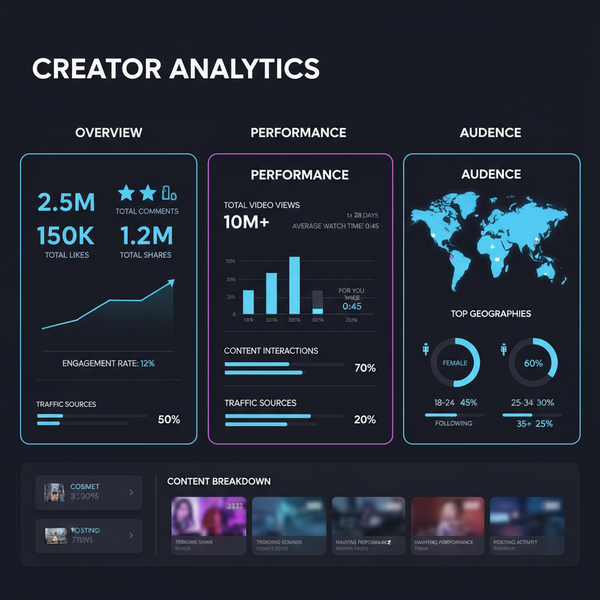
Tracking Engagement Metrics
Engagement metrics indicate how active and responsive your audience is to your content. You should track:
- Likes & Reactions – measure positive sentiment and emotional tone.
- Comments – track conversation and community involvement.
- Shares – gauge virality and advocacy.
- Click‑throughs – see if posts drive traffic to desired destinations.
> Tip: Calculate engagement rate (engagements ÷ reach) to normalize data across posts with varying reach. This helps you fairly compare content performance.
---
Analyzing Reach and Impressions Trends
Reach equals the number of unique users who see your content; impressions are total views including repeats. Insights visualizes these metrics over time.
Steps:
- In Overview, locate Post Reach.
- Adjust date ranges for month‑by‑month trends.
- Identify spikes and correlate them with specific post types or events.
---
Reviewing Post Performance
The Posts tab excels at revealing top‑performing content types.
Possible trends:
- Videos outperform static images.
- Carousel posts boost click rates.
- Short captions yield stronger engagement.
Here’s an HTML sample showing post types and metrics:
| Post Type | Average Reach | Engagement Rate | Top Reaction |
|---|---|---|---|
| Video | 5,400 | 7.2% | Love |
| Image | 4,100 | 5.9% | Like |
| Link | 3,200 | 4.3% | Like |
| Carousel | 6,150 | 8.1% | Love |
---
Checking Audience Demographics
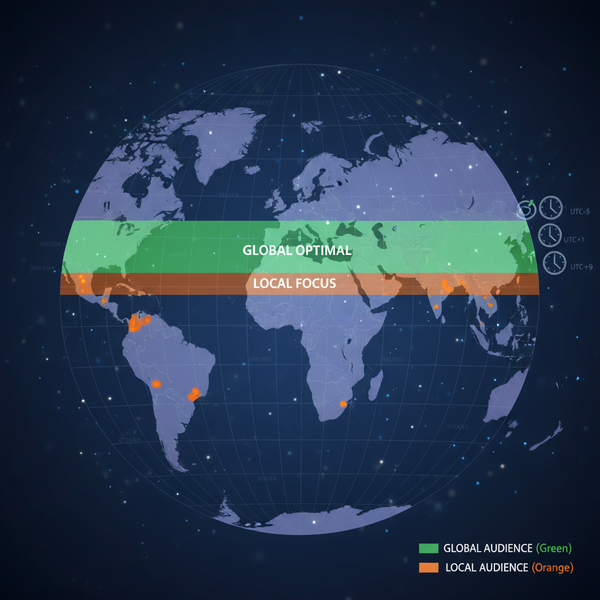
The Audience section reveals followers’ age, gender, and location. Tailoring your content to match the audience profile raises relevance and engagement.
Example insights:
- Majority aged 25–34
- 60% female, 40% male
- Top cities: New York, London, Sydney
Use this to guide language nuances, cultural references, and posting schedules.
---
Examining Page Views and Actions on Page
Beyond post‑level data, Insights offers:
- Page Views – total visits to your Facebook Page.
- Actions on Page – clicks on contact info, CTAs, or navigation links.
These reflect broader brand interest and practical intent to connect with you.
---
Monitoring Optimal Posting Times
Knowing when your audience is most active maximizes engagement potential.
In Posts, Facebook displays peak times by day and hour. Plan to publish during these high‑activity windows and match them with successful content types for a comprehensive schedule.
---
Using Free Third‑Party Tools
To expand your analysis without costs, try:
- Google Data Studio / Looker Studio – import exports for custom visualizations.
- Buffer Analyze (free tier) – view basic engagement graphs.
- Fanpage Karma (trial) – short‑term deeper metrics.
> Note: Only use tools that comply with Facebook’s API policies to prevent data access issues.
---
Comparing Current vs Past Performance
Insights’ date filter allows you to compare performance across periods:
- Select the last 30 days.
- Export data to CSV.
- Repeat for the prior 30 days.
- Compare key metrics: reach, engagement rate, follower growth.
This helps you spot trends and gauge the success of strategy adjustments.
---
Applying Findings to Content Strategy
Put your data to work:
- Prioritize content formats that perform well.
- Adjust timing based on activity patterns.
- Target posts using demographic insights.
- Test variations and track changes.
This data‑driven approach improves efficiency and return on effort.
---
Setting Regular Analysis Intervals
Consistency matters:
- Weekly – quick performance check on recent posts.
- Monthly – identify content trends and adjust accordingly.
- Quarterly – make strategic shifts based on longer trends.
---
Tips for Accurate Interpretation
Avoid common mistakes:
- Factor in seasonality and external events.
- Remember: correlation ≠ causation.
- Don’t overreact to anomalies from single posts.
- Use engagement rates in context with raw metrics.
Accurate reading of data ensures confident decision‑making.
---
Summary
You can analyze Facebook Page free using Insights tools to extract valuable metrics without sacrificing depth. From engagement rates to audience demographics, optimal posting times to comparative period analysis, Facebook’s free dashboard offers what you need to build an effective strategy. Use compliant third‑party tools for supplemental insight, and schedule regular reviews to keep content relevant and high‑performing.
Take action now—log into your Page Insights today and start refining your content strategy with data you already own.