Analyzing Content Engagement: A Practical Guide to Metrics, Methods, and Revenue Impact
Learn practical engagement metrics, instrumentation, and frameworks that tie content to outcomes and revenue across web, social, video, and email.

Understanding how audiences engage with your content takes more than chasing vanity metrics. This guide lays out practical metrics, instrumentation patterns, and analytical frameworks that connect engagement to business outcomes and revenue. Use it as a repeatable playbook to diagnose, optimize, and demonstrate impact across web, social, video, and email.
Analyzing Content Engagement: A Practical Guide to Metrics, Methods, and Revenue Impact

Why “analyzing content engagement” matters
Content engagement is the degree to which people actively consume, interact with, and return to your content across channels. It’s not a single number—it’s a behavior pattern tied to outcomes. When you analyze engagement, the goal isn’t vanity metrics; it’s to understand how content advances business objectives.
Tie engagement to the four canonical outcomes:
- Awareness: Reach quality and first exposure effectiveness.
- Consideration: Depth of interaction and intent signals.
- Conversion: Concrete actions toward business value.
- Retention: Habit-building and loyalty over time.
Think channel by channel:
- Web: Read depth, time spent with intent, actions taken.
- Social: Content saves/shares, meaningful discussion, return views.
- Video: Watch time and where viewers drop off.
- Email: Opens are table stakes; clicks and dwell time tell the story.
The through line: measure signals that correspond to user progress along a journey, not just activity for activity’s sake.
---
Essential metrics and how to read them
Below is a compact mapping of core metrics to what they really mean and common misreads.
| Channel | Metric | What it signals | Read it correctly |
|---|---|---|---|
| Web (GA4) | Engaged sessions | Sessions with intent: lasted >10s, or had ≥2 pageviews, or a conversion | Better than raw sessions; inverse of GA4 bounce rate. Use alongside traffic quality by source. |
| Web (GA4) | Average engagement time | Foreground time on page/app | Less inflated than legacy session duration; compare medians and interquartile range to spot skews. |
| Web | Scroll depth distribution | How far readers actually read | Look at distribution (25/50/75/90%) not just max; combine with click-through to next action. |
| Web (GA4) | Exits vs. Bounce rate | Exit: last page in a session; Bounce: not engaged | High exits on support articles can be success; high bounces on landing pages indicate mismatch. |
| Social | Saves, shares, comments rate | Value density and discussion-worthiness | Prioritize saves/shares over raw impressions. Normalize by reach for rate-based comparisons. |
| Video | Watch time & avg view duration | Total and per-view depth of consumption | Short videos can outperform on completion rate; watch time explains algorithmic distribution. |
| Video | Retention curve | Where viewers drop off | Identify the first big drop and optimize the hook/structure around that timestamp. |
| Click-to-open rate (CTOR) | Relevance of content after open | Better than CTR for content resonance; segment by link type to find high-intent patterns. | |
| Dwell time | Time spent reading the email | Provider-estimated; look at “read” percentage buckets. Use trends, not absolutes. |
Quick GA4 clarifications:
- Engaged session is recorded when any of the following occur: session > 10 seconds, at least 2 page/screen views, or a conversion event.
- Bounce rate (GA4) is the percentage of sessions that are not engaged.
- Enhanced measurement “scroll” fires at the first 90% scroll only—add custom quartile events for full distributions.
---
Instrumentation and data quality: build a trustworthy spine
Analytics is only as good as its instrumentation. Establish a consistent taxonomy and harden collection against privacy and browser changes.
- Event taxonomy and parameters
- Define a small set of verbs and nouns: view, click, submit, download; article, video, webinar, calculator.
- Parameters: content_id, content_type, topic, author, word_count, percent_scrolled, cta_type, placement.
Example event schema sketch:
{
  "event_name": "content_view",
  "params": {
    "content_id": "post_1234",
    "content_type": "article",
    "topic": "analytics",
    "author": "jdoe",
    "word_count": 1750
  }
}- GA4 enhanced measurement tuning
- Keep “scroll” on, but add custom events for 25/50/75/90 percent_scrolled.
- Track site search terms (view_search_results), file downloads, outbound clicks with meaningful parameters.
- Content grouping and topic tags
- Use a content_group dimension (e.g., “Guides,” “Case Studies,” “Docs”) and a topic parameter for clustering.
- UTM governance
- Standardize utm_source, utm_medium, utm_campaign, utm_content. Use lowercase, no spaces, controlled vocabularies.
- Prefer utm_id for unique campaign IDs and consistent linking with ad platforms.
- Cross-domain tracking
- Configure GA4 linker for domains (www.example.com → app.example.com → checkout.example.com) to preserve session continuity.
?utm_source=newsletter&utm_medium=email&utm_campaign=2025-10-product-launch&utm_content=cta_primary- Bot and internal filtering
- Enable GA4 internal traffic and developer traffic filters. In BigQuery, exclude known bot user-agents and abnormal hit rates.
- Consent Mode and privacy
- Implement Consent Mode v2 to respect user choices while modeling gaps. Ensure default-deny until consent, and document regions affected.
- Server-side tracking
- Route events via a server-side tag manager (first-party endpoint) to mitigate third-party cookie loss and adblockers. Keep a DPIA and comply with local law.
---
Segment and cohort analysis that actually explains behavior
Don’t accept averages. Slice by:
- Source/medium and campaign: organic vs paid, partner vs social.
- Device: mobile vs desktop behavior deltas.
- Geography and locale: language matters for engagement time and bounce.
- Persona: user-scoped custom dimension from signup/profile or inferred via content affinities.
- Content type and topic clusters: articles vs videos; “analytics” vs “security” clusters.
Cohorts for habit-building:
- Newsletter cohorts: group by first-open week; track 4–8 week open and click retention.
- Series cohorts: group by first-article consumption; measure return to next parts and completion of the series.
Example GA4 BigQuery cohort query (article return within 28 days):
WITH first_reads AS (
  SELECT
    user_pseudo_id,
    MIN(event_date) AS first_date
  FROM `project.analytics.events_*`
  WHERE event_name = 'content_view'
    AND event_params.value.string_value = 'article' -- content_type
  GROUP BY user_pseudo_id
),
returns AS (
  SELECT
    fr.user_pseudo_id,
    fr.first_date,
    e.event_date AS return_date
  FROM first_reads fr
  JOIN `project.analytics.events_*` e
    ON e.user_pseudo_id = fr.user_pseudo_id
   AND e.event_name = 'content_view'
   AND e.event_date BETWEEN fr.first_date AND DATE_ADD(fr.first_date, INTERVAL 28 DAY)
)
SELECT
  first_date,
  COUNT(DISTINCT user_pseudo_id) AS cohort_size,
  COUNT(DISTINCT CASE WHEN return_date > first_date THEN user_pseudo_id END) AS returned_users,
  SAFE_DIVIDE(COUNT(DISTINCT CASE WHEN return_date > first_date THEN user_pseudo_id END),
              COUNT(DISTINCT user_pseudo_id)) AS return_rate_28d
FROM returns
GROUP BY first_date
ORDER BY first_date;
---
Frameworks to diagnose and prioritize
Use established frameworks to avoid “metric soup.”
- HEART for content
- Happiness: NPS for content, satisfaction surveys, helpfulness votes.
- Engagement: engaged sessions, watch time, saves/shares, scroll depth.
- Adoption: new subscribers, new feed followers, first-time content interactions.
- Retention: return readers, newsletter open retention, series completion.
- Task success: CTA clicks, downloads, successful task completion (e.g., setup guide completion).
- AARRR (adapted to content)
- Acquisition: organic visits, social reach, subscribes.
- Activation: first engaged session, first save/share, first click to product.
- Retention: repeat visits, weekly active readers/viewers.
- Revenue: assisted conversions, trial signups from content, lead quality.
- Referral: shares, UTM_referrals from copied links.
- ICE scoring for experiments
- Impact: estimated effect on HEART/AARRR outcomes.
- Confidence: data support and variance history.
- Effort: design, copy, engineering time.
- Pick experiments with high `I*C/E` to maximize throughput.
- Jobs-To-Be-Done (JTBD)
- Form hypothesis statements: “When I’m evaluating vendors, I want a checklist so I can compare quickly.”
- Map behaviors to jobs: high scroll + outbound clicks to docs may indicate “implementation planning” job.
Simple HEART mapping table:
| HEART | Example metric | Decision it informs |
|---|---|---|
| Happiness | Helpfulness rating | Keep/kill content sections |
| Engagement | Avg engaged time | Long-form vs short-form investment |
| Adoption | New subscribers | Lead magnets and onboarding |
| Retention | 7-/28-day return rate | Series planning and cadence |
| Task success | CTA completion rate | CTA design and placement |
---
Turn insights into action: practical optimization checklist
Content and UX optimization moves the needle when grounded in your diagnostics.
- Craft for clarity
- Optimize headlines and first 100 words for promise and specificity (match intent and keywords without clickbait).
- Structure for scanners: subheads every 3–4 paragraphs, bullets, bolded key phrases, TL;DR summary.
- Improve readability: 8–10th-grade reading level; short sentences; alt text for images; captions for videos.
- Navigation and next steps
- Internal linking to related pieces and topic clusters.
- Contextual CTAs: “Compare plans,” “Get the checklist,” “Try the demo”—match JTBD.
- Performance
- Page speed: optimize LCP elements, lazy-load below-the-fold media, preconnect critical origins.
- Media: serve responsive images, WebP/AVIF, compress videos; use adaptive streaming for long-form.
- Editorial ops
- Refresh calendar: update top decaying posts quarterly; add new data, fix broken links, improve examples.
- Consolidate cannibalized pages: merge overlapping content and 301 redirect to the winner.
- Create follow-ups: when engagement is high but conversion is low, produce MOFU/BOFU assets that bridge the gap.
---
Experiment with rigor and respect causality
Design tests that isolate change from noise.
- A/B test candidates
- Titles and intros, hero imagery, content layout (single vs multi-column), CTA placement and copy.
- Advanced approaches
- Multivariate tests for high-traffic hubs to optimize combinations.
- Multi-armed bandits to exploit early winners when exploration cost is high.
- Guardrail metrics
- Bounce/engagement rate, LCP/CLS, scroll depth, unsubscribe rate (email), negative feedback (social hides).
- Control for external factors
- Seasonality and news cycles: use time-based randomization or stratify by day-of-week.
- Difference-in-differences: compare change on treatment pages vs matched control pages over the same window.
- Holdouts: keep a percentage of audience on the old experience for longer to verify sustained impact.
- Power and duration
- Pre-calculate sample size and minimum detectable effect; avoid peeking. Stop when you hit power, not when you like the result.
Test plan template (sketch):
Hypothesis: Moving the primary CTA above the fold increases click-to-lead by 15% for comparison guides.
Primary metric: CTA click-through to lead form
Guardrails: Engagement rate (no drop >2pp), LCP (<2.5s), unsubscribe rate (email)
Segmentation: New vs returning; mobile vs desktop
MDE: 12%; Alpha: 0.05; Power: 0.8; Estimated duration: 14 days
---
Connect engagement to revenue
To justify investment, link micro-behaviors to commercial outcomes.
- Map the funnel
- Content micro-conversions: downloads, newsletter subscribes, product tour views, calculator usage.
- Pipeline: MQL → SQL → Opportunity → Revenue.
- Build event-to-stage mapping and track conversion rates by source and content type.
- Attribution that respects content’s role
- Use assisted conversions reporting and position-based or data-driven attribution. Last click under-credits TOFU content.
- For self-serve products, model “content touch density” prior to signup and correlate with activation and retention.
- Lead scoring by content consumption
- Assign higher points to high-intent content (pricing, comparisons, implementation guides), recency-weight interactions, and multi-session depth.
- KPI tree linking content to revenue
Pricing page view: +10
Comparison guide 50% scroll: +8
Webinar attended: +12
Docs deep dive (3+ pages): +6
Decay: -25% after 14 days of inactivity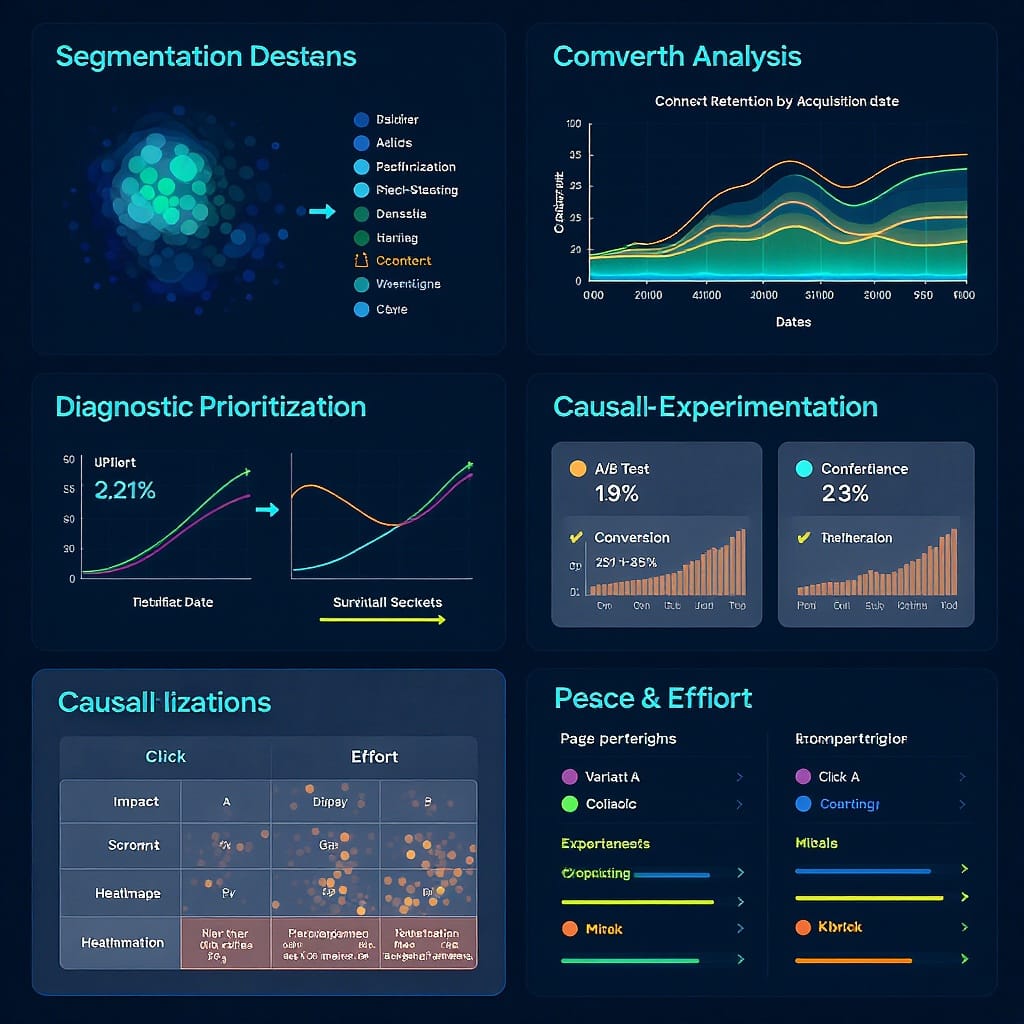
Example narrative:
- Inputs: impressions → engaged sessions → saves/shares → newsletter subs.
- Mid-funnel: subs → repeat sessions → product CTA clicks → trials/MQLs.
- Down-funnel: trials → activations/SQLs → opportunities → revenue.
- Monitor elasticity: a 10% lift in engaged sessions from organic yields X% lift in trials, holding mix constant.
---
Avoid pitfalls and set realistic benchmarks
- Don’t mix channels without normalization
- Compare within-channel or normalize by impression/reach. Email CTOR vs web CTR is apples/oranges.
- Sample size and survivorship bias
- Avoid conclusions from thin segments; report confidence intervals. Don’t only analyze content that “survived” updates.
- Bots and spam
- Monitor sudden spikes with zero engagement. Maintain IP/user-agent deny lists. Validate form leads with enrichment.
- Resist clickbait
- Spiky CTR with low satisfaction erodes trust and long-term retention (and can hurt search visibility).
- Prepare for privacy shifts
- Third-party cookies are going away; rely on first-party data, consented identifiers, server-side collection, and modeled conversions.
- Establish baselines by type and source
- Benchmarks differ: a 6-minute article baseline on organic may be a 2-minute baseline on social. Track improvements against your own medians and cohort trends.
---
Putting it all together: a repeatable playbook
- Define goals and jobs: Clarify outcomes per channel with HEART/AARRR lens and JTBD hypotheses.
- Instrument: Finalize taxonomy, GA4 tuning, UTMs, consent mode, server-side pipeline.
- Baseline: Snapshot engagement distributions and micro-conversion rates by segment and content cluster.
- Diagnose: Use retention curves, scroll distributions, and assisted conversion paths to locate friction and opportunity.
- Prioritize: Score actions with ICE; select a balanced slate across copy, UX, and performance.
- Experiment: Run well-powered tests with guardrails; account for seasonality and holdouts.
- Roll-out and monitor: Watch leading indicators (engagement) and lagging KPIs (pipeline/revenue) via your KPI tree.
- Iterate: Refresh winners, retire laggards, and feed learnings into your editorial roadmap.
Analyzing content engagement isn’t about chasing bigger numbers; it’s about uncovering intent, improving experiences, and compounding commercial impact with a system you can trust.
Summary
This guide helps you define meaningful engagement, measure it correctly across channels, and connect it to revenue. Instrument cleanly, segment and cohort your analysis, and use frameworks (HEART, AARRR, JTBD) to prioritize action. Test rigorously with guardrails, then operationalize wins and track impact through a KPI tree that links leading indicators to commercial outcomes.

