Average Instagram Engagement Rate 2025 Benchmarks by Industr
Discover 2025 Instagram engagement rate benchmarks by industry, content type, and influencer tier, plus key trends shaping audience interaction.
Understanding Instagram Engagement Rate in 2025
In 2025, Instagram continues to be one of the most important platforms for digital marketing, influencer campaigns, and brand storytelling. Measuring Instagram engagement rate remains essential because it reflects how actively your followers interact with your content — far beyond just counting followers.
A solid grasp of engagement metrics can help creators and brands refine their strategies for better audience connection and growth.
Engagement rate typically includes:
- Likes
- Comments
- Shares
- Saves
- Story interactions
- Reels plays and responses
Monitoring these signals provides a far more holistic picture of content performance than raw reach or impressions alone.

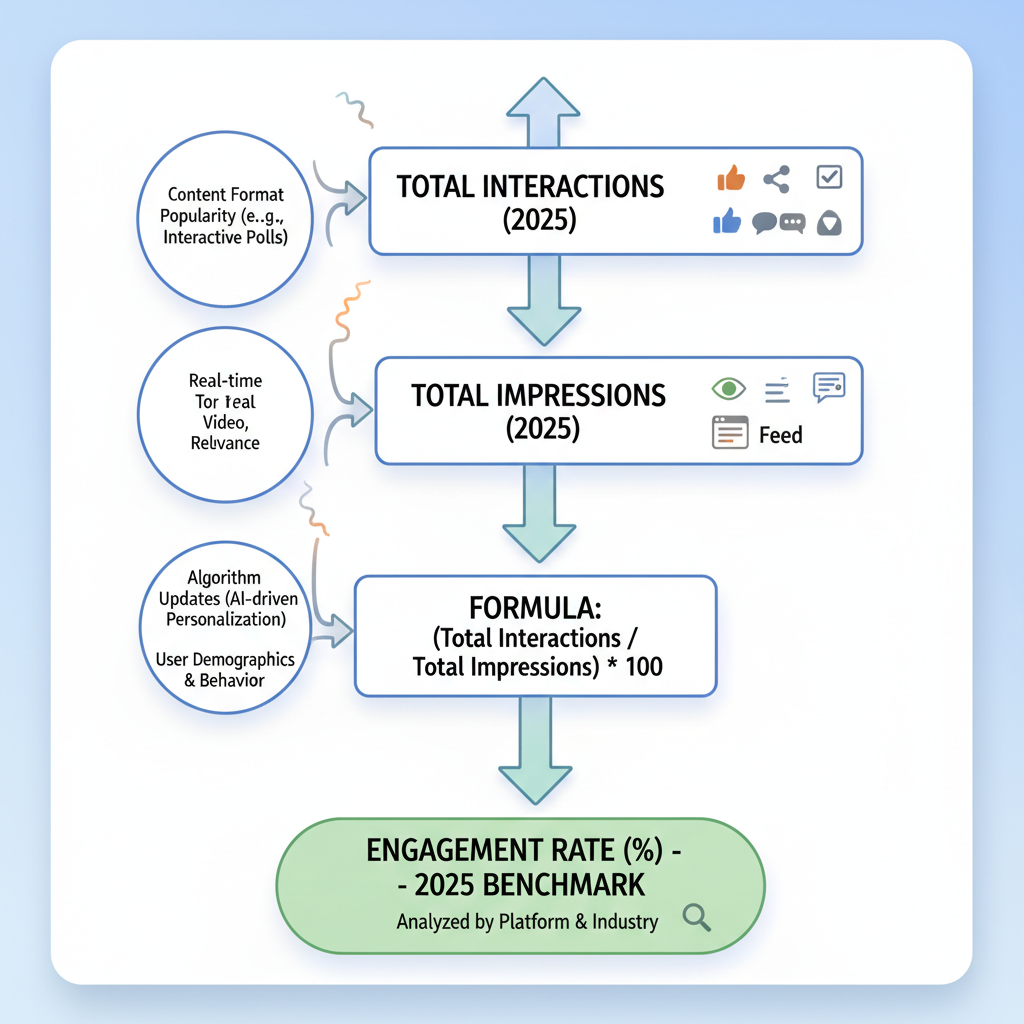
How Engagement Rate is Calculated in 2025
The way engagement rate is calculated has shifted slightly in response to Instagram’s evolving analytics tools and algorithm updates.
The standard 2025 formula for post engagement rate is:
Engagement Rate (%) = (Total Engagements / Total Followers at Posting Time) * 100Where Total Engagements may include:
- Likes
- Comments
- Shares
- Saves
- Video views (weighted in some updated models)
Instagram also offers an Engagement per Reach (EPR) metric:
EPR (%) = (Total Engagements / Reach) * 100Key update in 2025: Instagram separates active engagements (comments, shares, saves) from passive engagements (likes, single-tap reactions). Many marketers and analytics platforms now weigh active engagements more heavily when evaluating performance.
Global Average Instagram Engagement Rate in 2025
According to aggregated Q1 2025 data from major social analytics firms, the global average Instagram engagement rate for all account sizes is about 1.88% — a slight decrease from 2024, reflecting increased content saturation and competition.
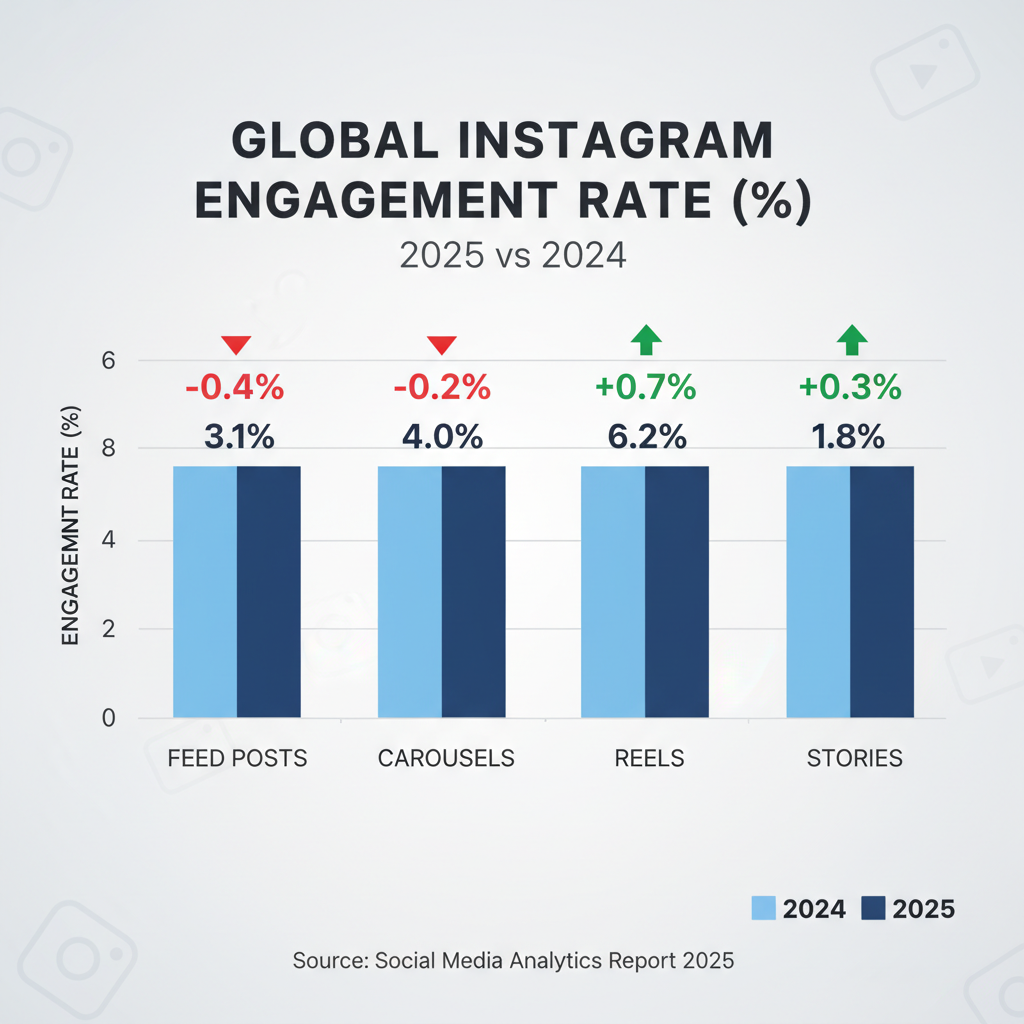
Engagement Rates by Content Type (2025 Averages)
| Content Type | Average ER (%) |
|---|---|
| Reels | 2.65 |
| Carousel Posts | 1.95 |
| Single Image | 1.32 |
| Stories | 0.89 |
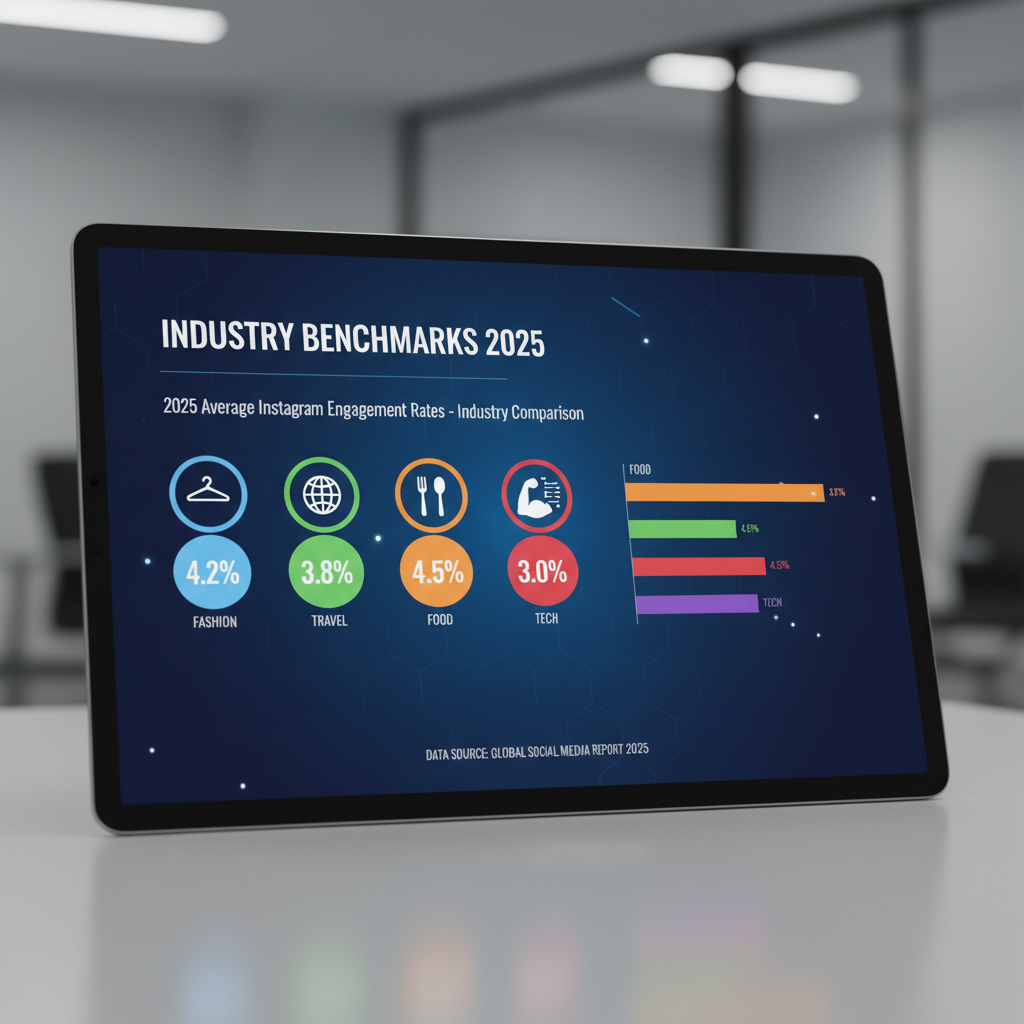
Industry-Specific Instagram Engagement Benchmarks 2025
Industry type significantly impacts engagement patterns. Here are the averages for some common niches:
| Industry | Average ER (%) |
|---|---|
| Fashion | 1.77 |
| Travel & Tourism | 2.12 |
| Fitness & Wellness | 2.45 |
| Beauty & Cosmetics | 1.95 |
| Technology | 1.41 |
| Food & Beverage | 2.23 |
Key Factors Influencing Engagement in 2025
Algorithm Shifts
Instagram's 2025 algorithm favors:
- Time spent on content
- Interactive elements like polls and quizzes
- Saves and shares prioritized over likes
Rise of Reels
Short-form video still enjoys the largest algorithmic advantage, especially in Reels and Explore tabs.
Carousel Posts
Swipeable posts encourage longer dwell time, increasing algorithmic favor.
How Follower Size Impacts Engagement Rate
Engagement rate often decreases as follower count grows because larger audiences may be less personally connected.
| Influencer Tier | Follower Range | Avg ER (%) |
|---|---|---|
| Nano | 1K - 10K | 4.12 |
| Micro | 10K - 50K | 2.93 |
| Macro | 50K - 1M | 1.45 |
| Mega/Celebrity | 1M+ | 0.89 |
Video vs Photo Engagement Trends
Video formats — especially Reels and Stories — outperform static images:
- Reels: Highest reach and discovery potential.
- Stories: Strong retention and daily user touchpoints.
- Static images: Best when paired with compelling, narrative captions to encourage engagement.
Best Practices to Boost Instagram Engagement Rate in 2025
1. Prioritize Quality Storytelling
Relatable, narrative-driven captions spark more saves and shares.
2. Use Engagement Hooks
Ask questions, add polls, and include clear calls-to-action in posts.
3. Post at Optimal Times
Leverage Insights to find when your audience is most active.
4. Mix Content Formats
Blend Reels, carousel posts, and Stories to broaden reach.
5. Encourage UGC
User-generated content fosters authenticity and deeper community bonds.
Using Instagram Insights and Analytics Tools
Instagram's native Insights in 2025 provide:
- Breakdown of engagement by content format
- Average time spent per post
- Profile actions post-engagement
Popular third-party tools:
- Sprout Social
- Later
- Hootsuite Analytics
- Iconosquare
These options help track performance over time, run A/B tests, and compare different formats effectively.
Common Mistakes That Reduce Engagement
- Posting excessive promotional content, causing audience fatigue.
- Failing to respond to comments and messages, weakening trust.
- Ignoring new format trends like Reels, limiting discoverability.
- Posting inconsistently, which disrupts algorithmic momentum.
Future Instagram Engagement Trends Beyond 2025
Expect big shifts ahead:
- AI-driven personalization will make engagement highly individualized.
- AR and VR content may appear in Stories and Reels for immersive experiences.
- Advanced engagement metrics tracking sentiment and time-on-content may be adopted.
Creators and brands who adapt quickly, focus on storytelling, and use data-driven experimentation will likely maintain above-average engagement rates as the platform evolves.
---
Summary & Next Steps:
By understanding and applying the average Instagram engagement rate 2025 benchmarks, you can realistically assess performance and align your strategy with top-performing formats. Focus on authentic interactions, experiment with various content types, and monitor analytics closely to stay ahead.
Start refining your Instagram strategy today to capture meaningful engagement and long-term growth.