Best Time to Go Live on TikTok (2025): Data-Backed Times and a Testing Plan
Find the best time to go live on TikTok in 2025 with data-backed global benchmarks, TikTok Analytics tips, and a 3-4 week testing plan to lock in peak slots.

A well-timed TikTok Live can dramatically amplify your reach, retention, and revenue, but “best time” depends on who you serve and where they are. This formatting-optimized guide gives you global starting points, then shows how to refine with TikTok Analytics and a practical 3–4 week testing plan. Use it to set smart hypotheses, test consistently, and lock in anchor times that compound.
Best Time to Go Live on TikTok (2025): Data-Backed Times and a Testing Plan
If you’re serious about growth on TikTok Live, timing is one of the highest-leverage variables you can control. The “best time to go live on TikTok” isn’t universal—it depends on your audience’s time zones, routines, and your niche. This guide lays out smart global starting points, then shows you how to localize with TikTok Analytics and a 3–4 week testing plan you can actually run.
Why timing matters on TikTok Live
- Push notifications: When you go live, a portion of your followers get notified. More of them are likely to join when they’re free (evenings, commutes, lunch).
- For You surface: Lives can appear in the For You feed and the Live tab. Early momentum (joins, comments, gifts) improves distribution.
- Concurrency compounds: The more people concurrently watching in the first 5–10 minutes, the stronger the social proof and the more likely the algorithm is to source additional viewers. Early critical mass is everything.
Translation: Your start time heavily influences your first 10 minutes, and your first 10 minutes heavily influence your entire session’s reach.
Know your audience first
Before you copy “best times,” map who you’re serving and when they’re free:
- Time zones: Identify your top countries and cities. If you have multi-region followers, segment your schedule by region.
- Age and routines:
- Students: After-school (3–6pm) and late evenings (8–10pm).
- 9–5 workers: Lunch (12–2pm) and prime time (6–10pm).
- Night owls (gaming/creative): Late nights (10pm–1am).
- Content consumption habits:
- Educational/quick tips: Midday and early evening breaks.
- Entertainment/chill: Evenings and weekends.
- B2B/pro creators: Weekday lunch and early afternoons.
- Platform behavior: Do your followers engage more M–Th or F–Sun? Use your video analytics to infer when your people are active.
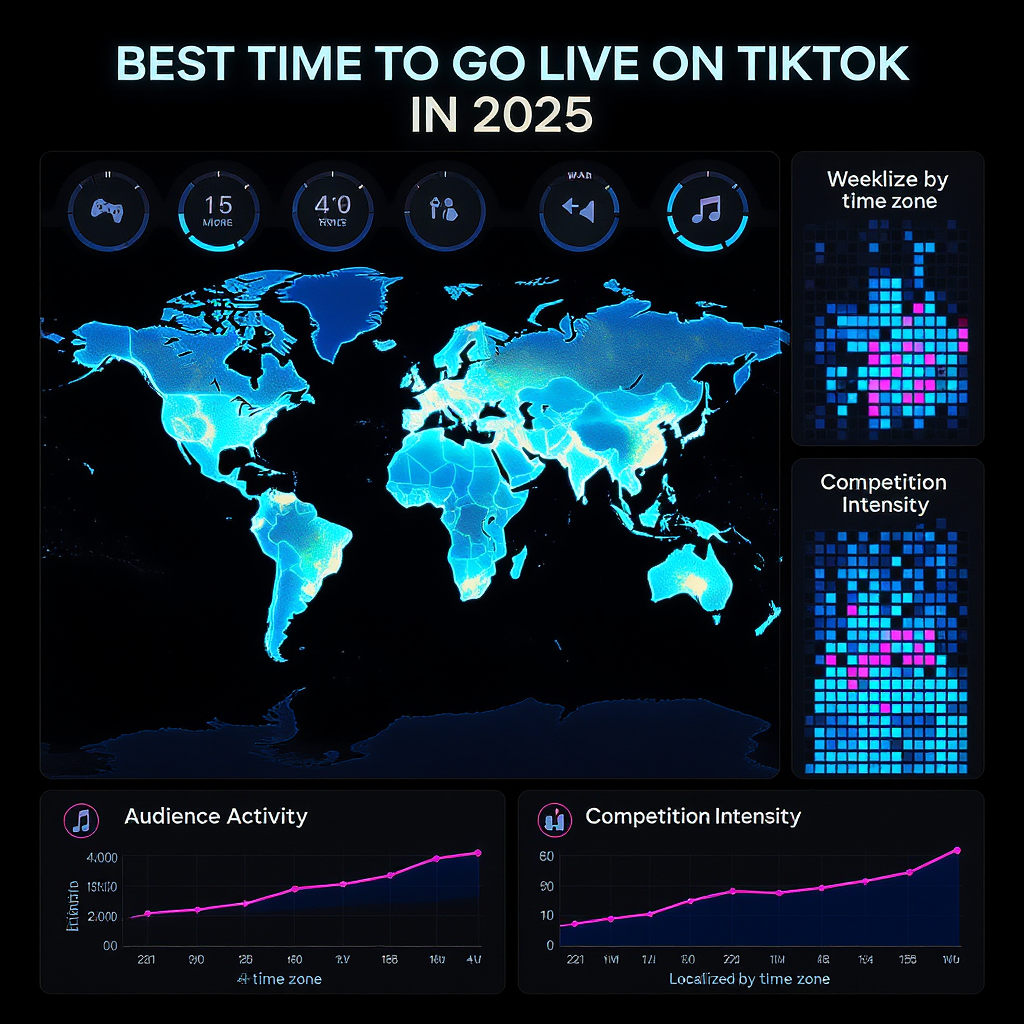
Global benchmarks to start with (then localize)
Use these as your first-pass hypotheses, then tune with data.
| Region | Mon–Thu Prime Window (Local) | Fri–Sun Prime Window (Local) | Alternate Tests | Notes |
|---|---|---|---|---|
| US/Canada | 7–10pm | 7–11pm | 12–2pm (B2B/education) | East vs. West Coast: consider 8pm ET and 8pm PT if audience is split. |
| UK/Europe | 6–9pm | 6–10pm | 12–1:30pm (B2B/quick tips) | Southern Europe may skew later on weekends (7–10pm+). |
| APAC (ANZ/SEA) | 7–10pm | 7–11pm | 12–2pm (education/light entertainment) | Consider language clusters; SEA evenings can be very strong. |
| East Asia (JP/KR/TW) | 7–10pm | 7–11pm | 7–9am (commute) small tests | Late-night gaming/creative can extend to 1am on weekends. |
Guiding principle: Start with prime-time evening slots for your audience’s local time. Layer in midday testing for formats that fit breaks (education, how-tos, product Q&A).
Weekdays vs. weekends: niche-specific patterns
- Gaming/creative build: Late nights often outperform (10pm–1am local), especially Fri–Sat.
- Shopping/e-commerce: Fri–Sun evenings are strong (7–10/11pm). Mid-week warm-up shows help seed your weekend audience.
- B2B/creator education: Lunch hours (12–2pm) or early afternoons (2–4pm) Tuesday–Thursday. Avoid Monday AM and late Fridays.
- Music/performances: Evenings always; experiment with Sunday early evenings for family-friendly sets.
- Co-creator collabs: Midweek (Tue–Thu evenings) for consistent availability and lower competition than Fridays.
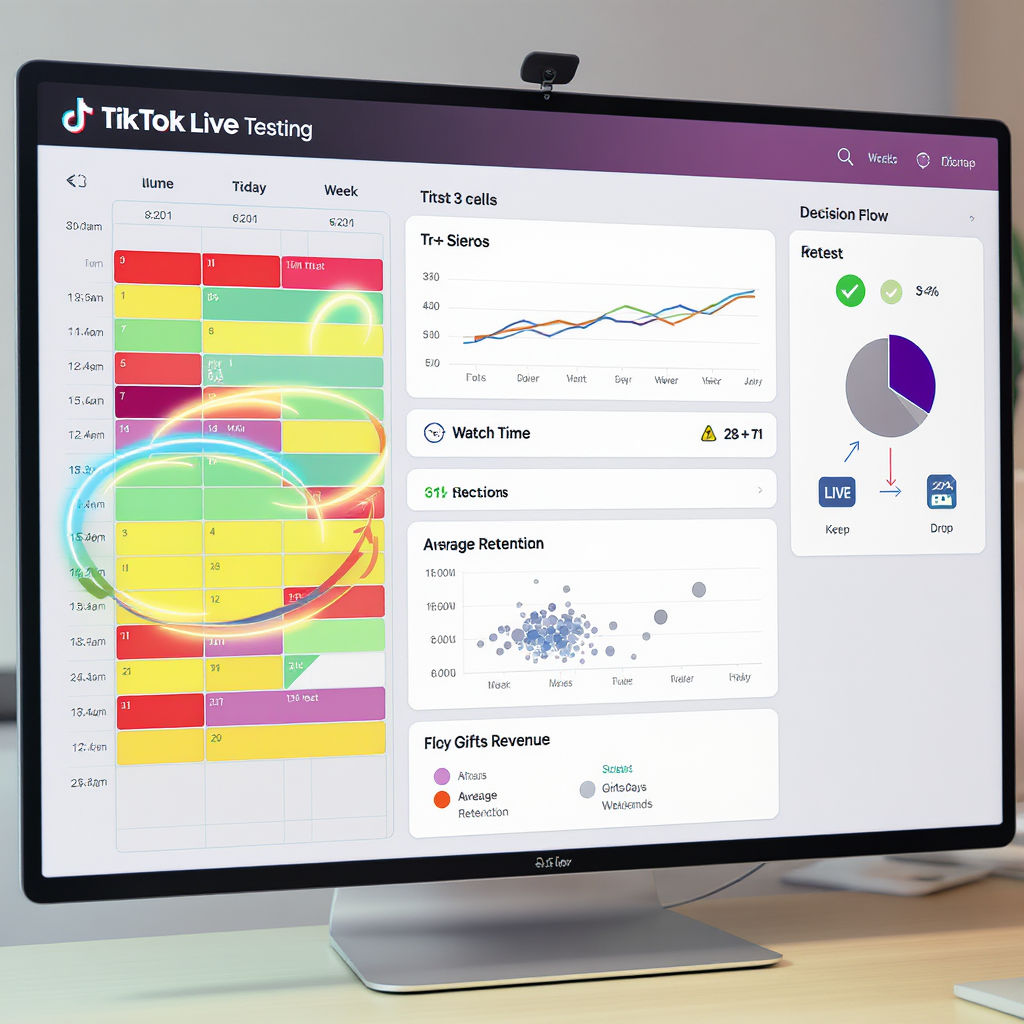
Use TikTok Analytics to find your best time
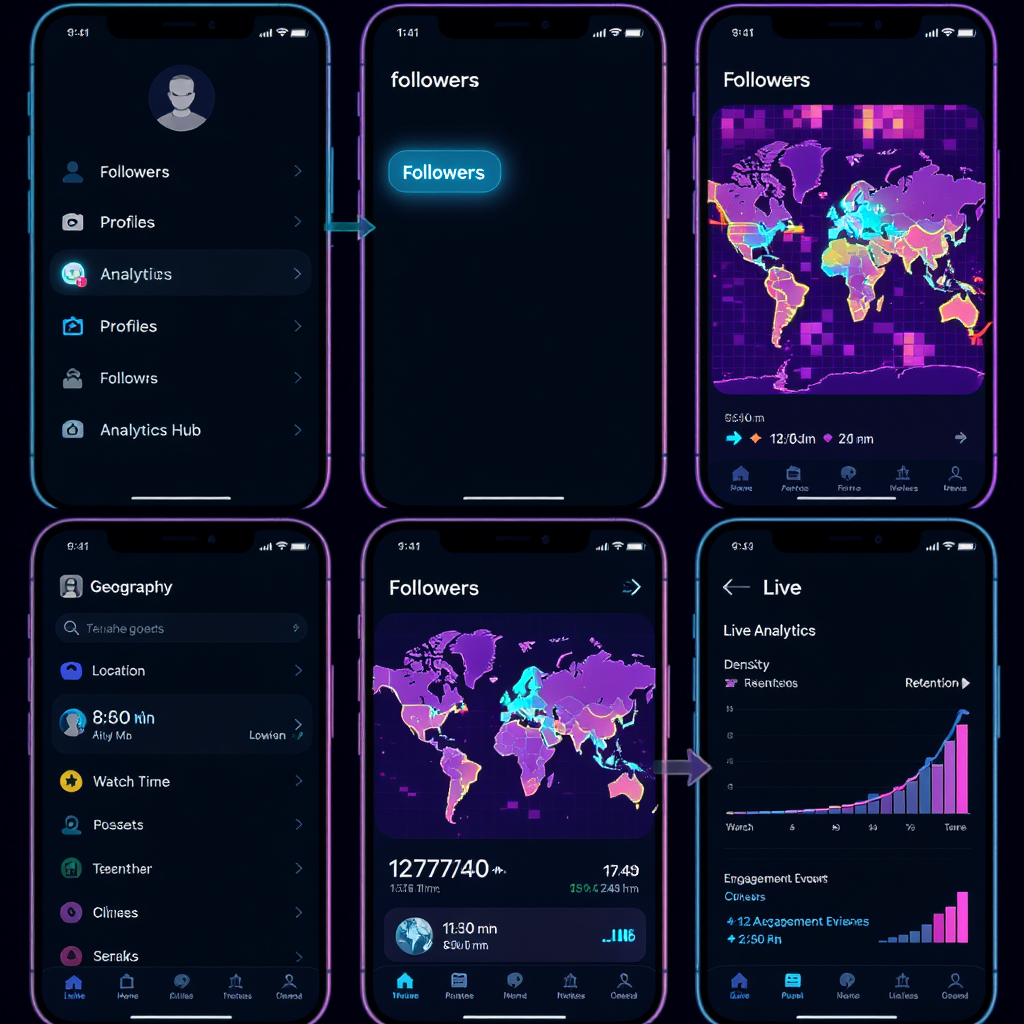
Where to find it
- Followers activity heatmap
- App: Profile > Menu (≡) > Creator tools or Business Suite > Analytics > Followers tab > Follower activity.
- Desktop analytics.tiktok.com (if available): Audience/Follower activity.
- Time zone note: TikTok typically displays times in your analytics time zone; however, some accounts see UTC. Confirm by testing a known local peak or checking your settings.
- Live analytics
- Profile > Menu > Creator tools > LIVE Center > LIVE analytics, or from the Live Center on desktop.
- Review: Peak concurrent viewers, average watch time, total viewers, new followers, gifts/revenue, retention curves.
How to read it
- Follower activity heatmap: Look for 2–3 contiguous dark blocks where your audience clusters. Those are your first test windows.
- Live analytics: Compare sessions by start time, not just date. Normalize results by duration (viewers per minute, gifts per minute) to be fair.
Key metrics to pay attention to
- Peak concurrent viewers (CCU peak)
- Average concurrency (mean viewers over session)
- Average watch time
- Retention at 5/10/20 minutes
- New follows per live
- Click-through to profile/links (via pinned comments or bio)
- Conversion/gift rate and revenue per viewer
Design a 3–4 week testing calendar
Goal
A/B 2–3 time slots per region with enough repeats to be confident.
- Choose 2–3 slots per region based on your follower heatmap plus the benchmarks above. Example for US East audience: 12:30pm, 7:30pm, 9:00pm.
- Control content: Keep topics/formats comparable. For product demos, rotate similar SKUs or scripts.
- Repeatability: Run each slot at least 3 times across different weekdays. Avoid one-off anomalies.
- Spread days: Don’t cluster all tests on weekends; include Tue–Thu.
- Duration control: Keep session length comparable (e.g., 60–75 minutes).
- Avoid confounders: Note paid boosts, special guests, major holidays, or app outages.
Sample 4-week calendar (edit times to your local)
| Week | Region | Slot A | Slot B | Slot C | Days | Notes |
|---|---|---|---|---|---|---|
| 1 | US/Canada (Eastern) | 12:30–1:45pm Tue | 7:30–8:45pm Wed | 9:00–10:15pm Fri | Tue/Wed/Fri | Educational topic rotation; no guest. |
| 2 | US/Canada (Eastern) | 12:30–1:45pm Thu | 7:30–8:45pm Tue | 9:00–10:15pm Sun | Tue/Thu/Sun | Same format; weekend slot C check. |
| 3 | UK/Europe | 12:00–1:15pm Wed | 6:30–7:45pm Thu | 8:30–9:45pm Sat | Wed/Thu/Sat | Localized offer; GBP pricing. |
| 4 | APAC (SEA) | 12:30–1:45pm Tue | 7:30–8:45pm Wed | 9:00–10:15pm Fri | Tue/Wed/Fri | Language-specific captions. |
Sample logging sheet (copy into Google Sheets or Notion)
date,start_time,region,slot,topic,duration_min,peak_concurrent,avg_concurrent,avg_watch_time_sec,retention_5m,retention_10m,retention_20m,new_follows,total_viewers,ctr_profile,ctr_link,gift_revenue,notes
2025-01-07,19:30,US-ET,B,Product Q&A,70,312,188,248,0.62,0.47,0.31,84,1620,0.11,0.04,86,"No paid boost"
2025-01-09,12:30,US-ET,A,3 tips tutorial,65,201,132,222,0.58,0.44,0.28,53,980,0.13,0.05,22,"Pinned link test"
What to track and how to judge success
Prioritize metrics that reflect both reach and quality:
- Peak concurrent viewers: Your “hook effectiveness” plus timing. Compare medians across repeats per slot.
- Average watch time and retention at 5/10/20 minutes: Quality and pacing. Good timing shouldn’t sacrifice retention.
- New follows per live and per viewer: Are you converting attention?
- CTR to profile/links: Especially for commerce or lead gen.
- Gifts/revenue per viewer minute: Monetization efficiency.
Decision framework
- Minimum sample: 3+ Lives per slot.
- Compare medians to avoid outliers. If Slot B’s median peak concurrent is ≥20% higher than Slot A and retention is within ±5% of Slot A, favor Slot B.
- Weighted score option:
Score = 0.35*(Median Peak CCU) + 0.25*(Avg Watch Time, sec) + 0.20*(New Follows)
      + 0.10*(CTR to Profile %) + 0.10*(Gifts/Viewer-Minute)
Pick the winner for your anchor weekly time and keep iterating for a second slot.
Optimize length and cadence
- Ideal session duration: 45–90 minutes. This window lets you build momentum, cycle through segments, and capture late arrivals without fatiguing the host.
- Re-intro hooks every 5–7 minutes: Welcome new viewers, restate value, recap offers. Lives are a rolling audience.
- Segment cadence:
- 0–3 min: Hook, agenda, pin your CTA.
- 3–10 min: First value segment/demo.
- 10–15 min: Q&A burst or interactive poll.
- Repeat segments; refresh the hook at each handoff.
- Handoffs and collabs: Co-hosts or guest takeovers keep concurrency up. Use multi-guest panels and plan handoffs to collaborators who go live right after you.
Pre-live and in-live amplification
- Countdown content: Post a teaser 12–24 hours prior. Use “Going live at 7:30pm with X—comment your questions.”
- Fresh short video 30–60 minutes pre-live: This primes your audience and places a fresh asset in their feed. Mention your go-live time and pin a “Live soon” comment.
- Cross-platform reminders: IG Story, X/Twitter, YouTube Community, Discord. Share the time in local time zones where your audience lives.
- Pinned comments and profile link: Pin the live’s primary CTA and ensure your bio link is clean and tappable.
- Co-hosting: Invite a relevant creator with overlapping audience. Co-hosted Lives can expand reach and improve early concurrency.
Seasonal and event timing
Adjust your “best time to go live on TikTok” around these shifts:
- Holidays: Audience routines change—earlier evenings during school breaks, later nights on New Year’s week.
- Product drops and launches: Align Lives to drop time + 1–3 hours after, when curiosity peaks.
- School calendars: Back-to-school and exam seasons push students to late evenings or weekends.
- Major TV/streaming tentpoles: Avoid direct conflict or smartly go live during intermissions/after-shows.
- Trending challenges: If your niche participates, schedule Lives as the trend crests (often 48–72 hours after breakout).
Putting it all together
- Start with local prime-time windows from the benchmarks table and one midday test for education/B2B.
- Use TikTok’s Follower Activity to choose 2–3 strongest hour blocks and the Live analytics to measure performance by time slot.
- Run a 3–4 week A/B plan with repeatable formats, track rigorously, and decide with medians and a weighted score.
- Lock in a consistent weekly anchor time, then add a complementary second slot for a different sub-audience.
Once you follow the data, your “best time to go live on TikTok” won’t be a guess—it will be a repeatable, compounding habit that grows reach, relationships, and revenue.
Summary
- Begin with local prime-time evening slots, validate against your Followers activity heatmap, and add a midday test where appropriate.
- Test 2–3 time windows over 3–4 weeks, control for content and duration, and compare medians to pick winners.
- Anchor a consistent weekly slot, maintain strong hooks and segment cadence, and adjust around seasons, drops, and events.