Best Time to Post on IG: A Data-Backed 2025 Guide to Timing, Time Zones, and Formats
Find your best posting times on Instagram in 2025 with a data-backed playbook: starter windows, time-zone strategy, and A/B testing for Feed, Reels, Stories.
This guide offers a practical, testable approach to finding your best posting times on Instagram in 2025. It explains how timing interacts with Instagram’s ranking systems across Feed, Reels, Stories, and Lives, and shows you how to use your own data to refine your schedule. Use it as a structured playbook: start with proven windows, validate with insights, and iterate with A/B testing.
Best Time to Post on IG: A Data-Backed 2025 Guide to Timing, Time Zones, and Formats

If you came here for a silver bullet, here it is: there isn’t one. The “best time to post on IG” depends on your audience’s local time, habits, content format, and your goals. That said, there are strong starting points and a clear, testable process to find your own peak windows.
The quick answer (and where to start)
- There’s no universal best time to post on IG.
- Start with your audience’s local time and common high-availability windows:
- Weekdays: 7–9 a.m. (commute/morning routine), 11 a.m.–1 p.m. (lunch), 5–8 p.m. (post-work wind-down).
- Saturdays lean later (9 a.m.–2 p.m.); Sundays early evening (5–8 p.m.).
- Post in 2–3 “anchor” slots per week, then refine using your own data.
Pro tip: If your followers span multiple time zones, pick the largest cluster first (e.g., Eastern Time) and test staggered posts for others.
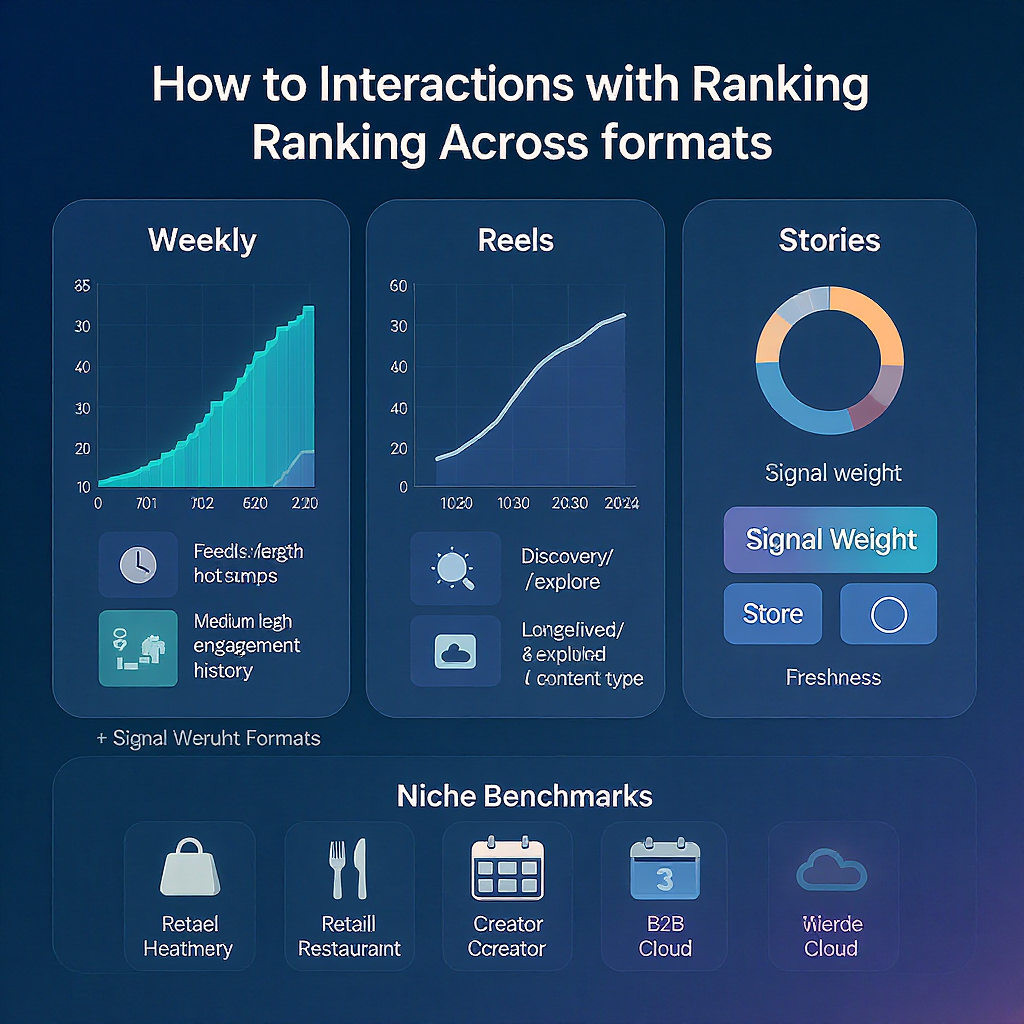
How Instagram’s ranking systems influence timing
Understanding how IG surfaces content clarifies why timing matters differently by format.
Feed and carousels
- Recency: Newer posts get an initial boost. Posting when followers are active increases first-hour engagement velocity (likes, comments, saves).
- Relationship: Users who often interact with you are more likely to see your posts. Consistent timing trains habitual viewing.
- Interest: If your content matches user interests, it’s prioritized. Strong early engagement (saves, long caption reads) helps reinforce interest signals.
Implication: For Feed, timing aims to maximize early interactions in the first 60–120 minutes.
Reels
- Discovery-first: Reels are distributed beyond followers, so the “day 1” matters for machine learning exploration.
- Watch time and replays: Completion rate, re-watches, and shares outweigh pure recency.
- Session fit: Reels binge behavior spikes during breaks and evenings.
Implication: Timing still matters (to kickstart watch time), but a great Reel can continue compounding for days. Optimize for your audience’s active windows and high attention states.
Stories
- Chronological priority: Stories appear at the top bar with recent ones first. Frequent, spaced updates keep you “bubbled” to the left.
- Reply and tap-through: Quick replies and DMs indicate relationship depth.
Implication: Post Stories in bursts across the day (morning + midday + evening) to stay visible, and time key frames (polls, links) to peak active hours.
Benchmarks by niche and goal
Use these as hypotheses, not rules. Your data wins.
| Niche / Goal | Primary Windows (Local Time) | Why It Works | Formats to Prioritize |
|---|---|---|---|
| B2C Retail (Impulse) | Weekdays 11 a.m.–1 p.m.; 6–8 p.m. • Weekends 10 a.m.–2 p.m. | Breaks and unwind windows suit browsing and add-to-cart behavior. | Reels for discovery; Carousels for product details; Stories with link stickers. |
| B2B (Decision-makers) | Tue–Thu 7–9 a.m. and 11 a.m.–12 p.m. | Workday mindset; pre-meeting scroll; lunchtime research window. | Carousels (educational), Reels (case snippets), Stories (webinar reminders). |
| Creators (Entertainment) | Weeknights 6–9 p.m.; Sat 10 a.m.–1 p.m. | Leisure time boosts watch completion and shares. | Reels first; Stories for community; occasional Lives for spikes. |
| Local Services | Weekdays 7–9 a.m.; 4–6 p.m.; weekend mornings | Planning windows (before/after work) drive inquiries. | Feed posts (trust), Stories (proof), Reels (before/after, tips). |
| Event Promotion (Conversion) | Event week: daily at 8 a.m. + 5–8 p.m.; day-of: 7 a.m., 1 p.m., 1 hour pre | Multiple reminders capture different schedules; urgency converts. | Stories with countdown stickers; Reels teasers; Live Q&A. |
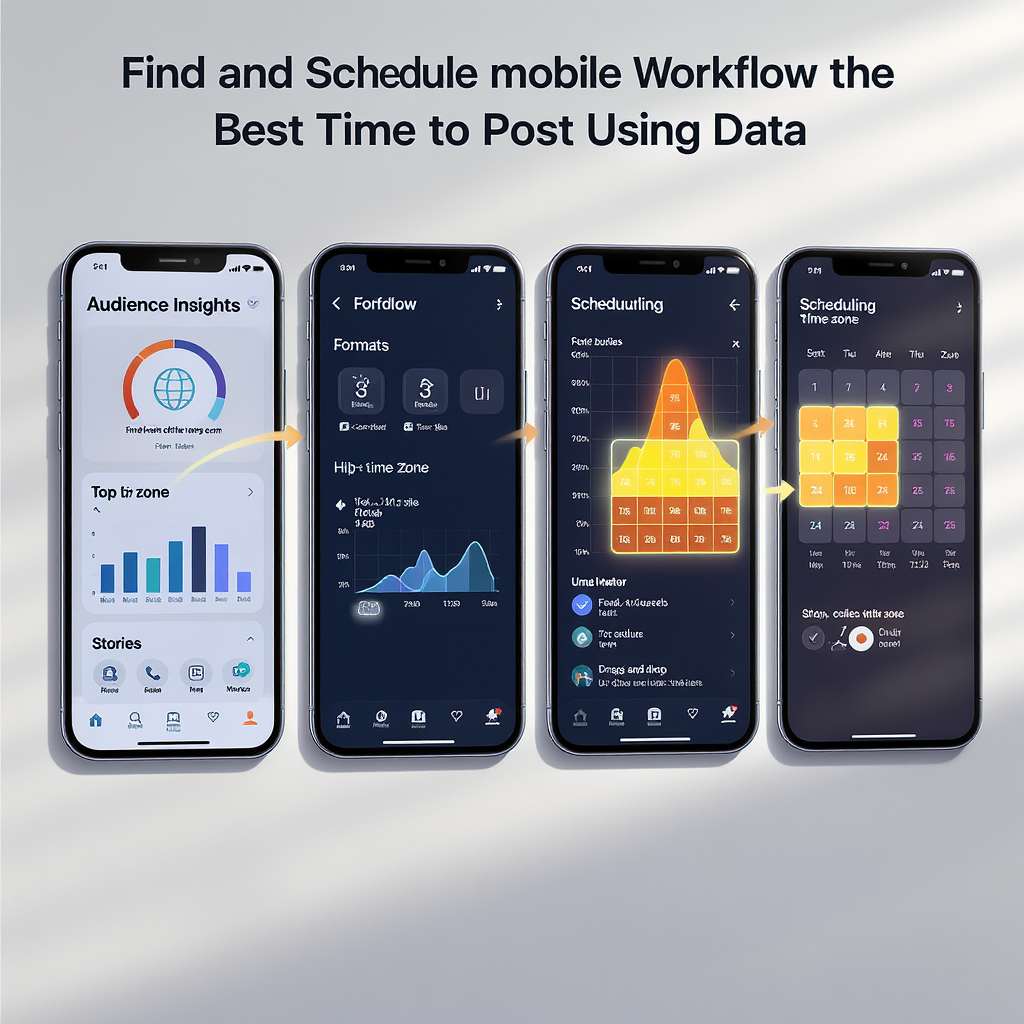
Find your best times using data
- Read Instagram Insights:
- Navigate to Professional Dashboard → Insights → Total followers → Most active times.
- Capture both Days and Hours; screenshot or export if available.
- Map time zones:
- Use your audience’s top locations to identify primary time zones.
- If >25% sits in a second zone, plan staggered or duplicate posts.
- Export to Meta Business Suite:
- Download post-level metrics (reach, saves, profile visits, watch time, link clicks).
- Tag each post with local audience time for the majority segment.
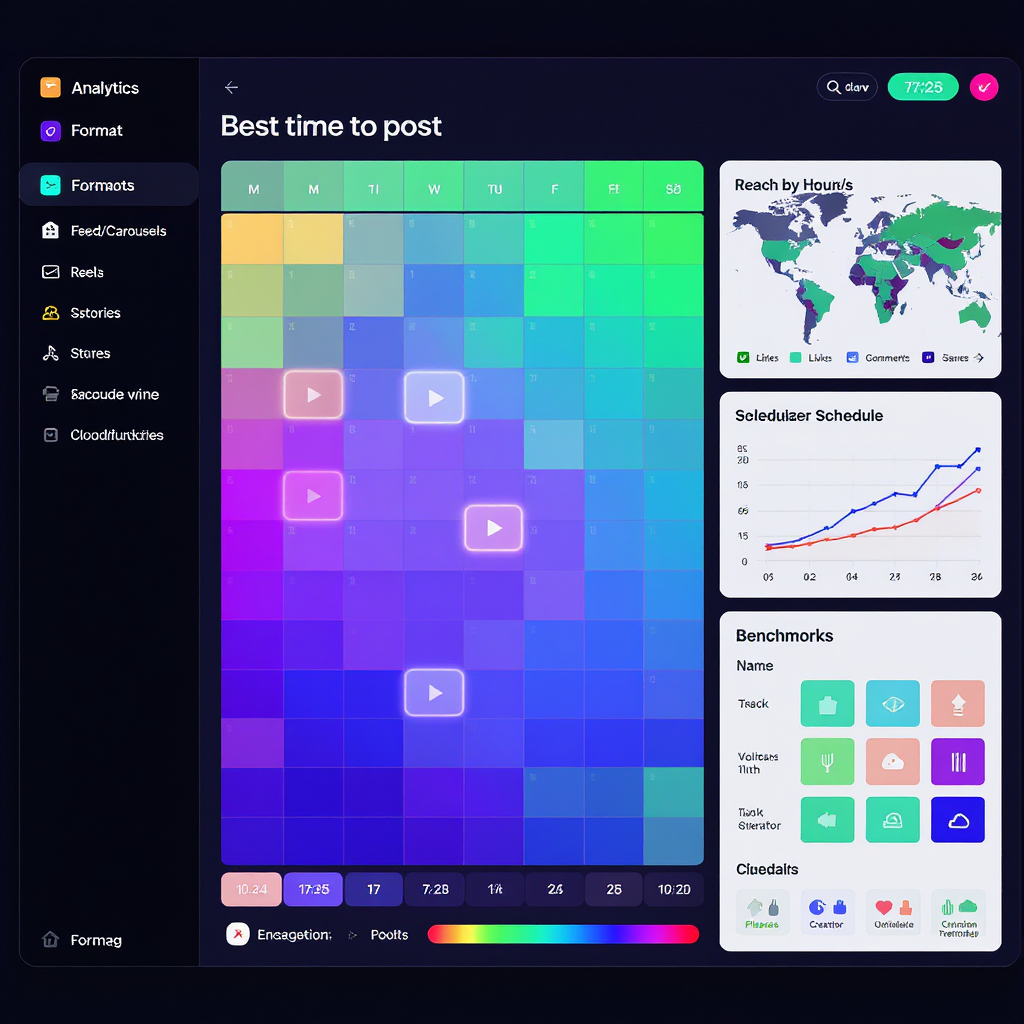
- Build an hour-by-day heatmap:
- Bin posts into day-of-week and hour-of-day.
- Compute performance per bin (e.g., median reach rate, save rate).
- Visualize to spot hotspots and dead zones.
Quick Python snippet to build a timing heatmap from exports
import pandas as pd
import numpy as np

## 1) Load your Meta Business Suite export (CSV with post_time ISO8601 and metrics)

df = pd.read_csv("ig_posts_export.csv", parse_dates=["post_time"])

## 2) Convert to your primary audience timezone

df["post_time_local"] = df["post_time"].dt.tz_convert("America/New_York")

## 3) Create bins

df["dow"] = df["post_time_local"].dt.day_name().str[:3]  # Mon, Tue, ...
df["hour"] = df["post_time_local"].dt.hour

## 4) Normalize metrics (e.g., reach per 1k followers, saves per 1k reach)

followers = 50000  # replace with your actual follower count at the time (or store per post)
df["reach_rate"] = df["reach"] / followers
df["save_rate"] = df["saves"] / df["reach"].replace(0, np.nan)

## 5) Aggregate by day-hour

agg = df.groupby(["dow", "hour"]).agg(
    posts=("id", "count"),
    med_reach_rate=("reach_rate", "median"),
    med_save_rate=("save_rate", "median")
).reset_index()

## 6) Pivot for heatmap

heatmap = agg.pivot(index="dow", columns="hour", values="med_reach_rate").fillna(0)

print(heatmap.round(3))
Interpretation: Prioritize bins with consistent medians and sufficient post count (≥3). Avoid overreacting to outliers with low sample sizes.
A/B test your slots (4-week plan)
Design principles:
- Test 3–5 distinct time slots you believe are promising.
- Control creative variables: rotate the same content themes across slots.
- Sample size: Aim for 3+ posts per slot before concluding; 5–10 is better.
- Metrics that matter:
- Reach rate (reach/followers)
- Saves rate and shares rate
- Profile visits per 1k reach
- Watch time and completion rate (Reels)
- Link click-through rate (Stories and bio link via UTM)
- For conversions, use consistent UTM tagging.
| Week | Slot A | Slot B | Slot C | Notes |
|---|---|---|---|---|
| 1 | Tue 8:00 a.m. | Thu 12:00 p.m. | Sat 11:00 a.m. | Use same theme rotation (educational, testimonial, offer). |
| 2 | Mon 6:00 p.m. | Wed 8:00 a.m. | Fri 5:00 p.m. | Match formats week-over-week (Reels vs. Carousel). |
| 3 | Tue 7:30 a.m. | Thu 1:00 p.m. | Sun 6:00 p.m. | Hold out one slot for a wildcard time. |
| 4 | Mon 12:00 p.m. | Wed 6:30 p.m. | Sat 9:30 a.m. | Evaluate: keep top 2; replace the laggard. |
Stat hygiene:
- Compare medians, not just averages.
- Use per-follower or per-reach rates to control for growth and virality.
- If possible, run the same creative on two slots separated by 7+ days to minimize novelty bias.
Time zones and global audiences
- Cluster regions: Group by North America, Europe, APAC, LATAM rather than dozens of cities.
- Stagger posts: Publish the same core creative across 2–3 windows 8–12 hours apart (consider tweaking caption and hook).
- Duplicate with intent: If duplicating Reels, delay 24–72 hours and adjust cover text and first 2 seconds to reduce “seen it” fatigue.
- Daylight saving shifts: Note DST changes for your top regions. Maintain local 8 a.m./noon/evening patterns rather than sticking to UTC.
- Multilingual captions: Use first sentence in the primary language of the time zone cluster; add translation or auto-translate prompt in the second line.
Cadence without cannibalization
- Frequency:
- Feed: 3–5 posts/week for most brands; creators may do daily if quality holds.
- Reels: 2–4/week; allow 24 hours of breathing room if a Reel is compounding.
- Stories: 5–15 frames/day, spaced into 2–3 bursts (morning/midday/evening).
- Spacing:
- Leave at least 4–6 hours between major posts to avoid overlap in early engagement.
- Don’t drop a Reel and a Carousel back-to-back; let one absorb attention.
- Cross-format amplification:
- Tease a Reel in Stories with the first 1–2 seconds and a “Watch full” sticker.
- Use a Carousel to summarize a Live replay; pin to profile if it drives DMs.
- Schedule Stories polls 1–2 hours before a Feed post to prime engagement.
Format-specific timing tips
- Reels:
- Peak when your audience has leisure attention (evenings, weekends).
- Avoid posting right before your audience’s commute if they’re drivers; aim just after.
- Strong hooks matter more than minute-by-minute timing, but timing fuels initial distribution.
- Carousels (Feed):
- Mornings and lunchtime perform well for educational swipes.
- Use the first slide as a bold promise; pin top performers to extend life.
- Stories:
- Post key CTAs during your audience’s most active hours (see Insights).
- Spread updates to stay at the front of the tray; avoid dumping 15 frames at 2 a.m.
- Lives:
- Schedule and use reminder stickers 24 hours and 30 minutes before.
- Best when your audience can commit (evenings Tue–Thu, Sunday early evening).
- Start with a 60–90 second warm intro for notification arrivals; recap at minute 3.
Troubleshooting dips
Seasonality and context often beat timing. Before you rewrite your schedule, check:
- Seasonality and holidays:
- Retail spikes around key shopping weeks; B2B lulls near major holidays.
- Sports finals, award shows, and national events can suppress attention.
- News cycles:
- Breaking news can overshadow content; consider pausing or reframing.
- Creative fatigue vs. timing:
- Falling hook-through and save rates suggest creative issues.
- If reach rate drops but save rate is steady, timing/distribution is likely culprit.
Quick diagnostic checklist
- Did follower activity (Insights) shift in the last 30 days?
- Are you over-posting (less than 4 hours between major posts)?
- Are Reels cannibalizing Feed on the same day?
- Are you posting outside top time zones (forgot DST)?
- Did you change content type (e.g., less Faces/talking head) or first-second hook?
- Are captions too long for morning skims or too dense for evenings?
- Are you competing with your own Live or a partner’s drop at the same time?
If 2+ answers point to timing, re-run a mini A/B test focusing on top two windows.
Putting it together: a simple playbook for the best time to post on IG
- Identify your largest time zone cluster and pull follower active hours.
- Pick 3 starter windows (e.g., Tue 8 a.m., Thu 12 p.m., Sun 6 p.m.).
- Run a 4-week rotation with controlled creative and track:
- Reach rate, saves rate, profile visits/post, watch time (Reels), CTR.
- Build and review an hour-by-day heatmap monthly; promote top slots to “primary.”
- For global audiences, stagger or duplicate across regions with localized captions.
- Adjust for seasonality and maintain spacing so formats amplify, not compete.
Example scheduling snippet (YAML)
timezone_primary: America/New_York
slots:
  - name: Morning_Edu
    day: Tuesday
    time: "08:00"
    format: Carousel
  - name: Lunch_Reel
    day: Thursday
    time: "12:00"
    format: Reel
  - name: Sunday_Prime
    day: Sunday
    time: "18:00"
    format: Reel
stories:
  cadence:
    bursts:
      - "08:30"
      - "13:00"
      - "19:00"
  ctas:
    - poll
    - link
    - countdown
ab_test:
  duration_weeks: 4
  metrics:
    - reach_rate
    - save_rate
    - profile_visits_per_1k_reach
    - reels_avg_watch_time
    - story_ctr
The bottom line: The best time to post on IG in 2025 is the time your audience proves with their taps, swipes, and watches. Start with the common windows, honor local time zones, and let your data settle the debate.
Summary
- There’s no universal “best time”; begin with common local windows and validate with your own Insights.
- Optimize by format: Feed favors early engagement, Reels reward watch time over days, Stories thrive on recency and cadence.
- Use a structured loop: identify time zone clusters, test 3–5 slots, track normalized metrics, visualize a heatmap, and iterate monthly.