Best Time to Post to Social Media: 2025 Data, Benchmarks, and a Proven Method
Find the best times to post in 2025 using platform benchmarks, B2B/B2C nuances, and a simple test framework to validate and automate your schedule.

Publishing when your audience is most available still amplifies reach and engagement—especially in 2025, when feeds balance recency with relevance. This guide consolidates directional benchmarks, B2B/B2C nuances, and a simple experiment framework to identify your true best posting windows. Use it as a practical playbook to test, validate, and automate a schedule that compounds early velocity into measurable outcomes.
Best Time to Post to Social Media: 2025 Data, Benchmarks, and a Proven Method
If you’ve ever wondered whether timing still matters, the short answer in 2025 is yes—just differently than it used to. Feed algorithms now balance recency with predicted interest, but early engagement and audience availability still determine whether your content takes off or flattens. This guide distills directional benchmarks for the major networks, shows how B2B/B2C and formats shift the optimal window, and gives you a proven, testable method to find the best time to post to social media for your unique audience.

TL;DR
- Timing still drives early velocity, which drives distribution.
- Use platform-specific windows as starting points—not gospel.
- Segment by region/time zone and by content format.
- Validate your timing with analytics, UTMs, and a simple A/B framework.
- Iterate on a 30-60-90-day plan with guardrails and automation.
---
Why Timing Still Matters in 2025
Algorithms reward content that earns early engagement from the right people.
- Recency still counts. Most feeds apply a decaying recency weight. Being fresh when your audience opens the app increases ranking odds.
- Early velocity compounds. Saves, shares, watch time, and clicks in the first 30–120 minutes send strong signals.
- Audience routines persist. Commutes, breaks, and evening downtime remain stable even as work patterns evolve.
- Time zones fragment reach. Global audiences mean “prime time” is plural. Posting once for everyone usually underserves someone.
Think of timing as improving the baseline probability that your post is shown to the first cohort most likely to engage. That first cohort’s response shapes the rest of the distribution curve.
---
Quick Platform Benchmarks (Directional, Not Absolute)
Use these 2025 windows as hypotheses to test. All times are local to the audience, not your HQ.
| Platform | Usual Peaks (local) | Secondary Windows | Caution/Avoid | Notes |
|---|---|---|---|---|
| Weekdays 9–11 AM; 7–9 PM | Sat 10 AM–1 PM | 1–4 AM | Reels can do well evenings; Stories all-day with morning anchor. | |
| TikTok | 7–11 PM; 6–9 AM | Sat–Sun 11 AM–2 PM | Mid-workday 2–4 PM | Lean into off-work hours; test late-night for Gen Z. |
| 11 AM–2 PM | 5–7 PM | After midnight | Groups thrive evenings; link posts often better midday. | |
| X (Twitter) | 7–9 AM; 12–1 PM | 5–7 PM | 3–5 AM | News/events break the rules—post when the conversation starts. |
| Tue–Thu 8–10 AM | 12–1 PM | Late nights; most weekends | B2B sweet spot; long-form/caros early morning. | |
| 8–11 PM | Sat–Sun 10 AM–1 PM | Workday mornings | Planning mindset peaks evenings/weekends. | |
| YouTube | 5–9 PM | Sun 2–6 PM | Weekday early AM | Publish 2–3 hours before expected peak to allow indexing. |
| Threads | 8–10 AM; 12–2 PM | 6–8 PM | After midnight | Engagement mirrors IG+X; conversational cadence helps. |
These are starting points. Your brand, audience, and content mix will bend these windows.
---
B2B vs. B2C and Industry Nuances
B2B and B2C audiences show different daily rhythms and intent states.
- B2B (SaaS, services, manufacturing)
- Best windows: Tue–Thu mornings, lunchtime. Avoid late-night.
- Align with buyer journey milestones: product updates before work, thought leadership early morning.
- SaaS nuance: launch notes at 8–9 AM regional time; webinars announced Tue mornings; follow-ups Wed noon.
- B2C (e-commerce, hospitality, media)
- Best windows: evenings and weekends. Browsing and impulse action increase after work.
- E-commerce: payday cycles (1st, 15th) and evenings; cart recovery content in late evening.
- Hospitality: Thu–Fri for weekend planning; mornings for booking behavior; local lunch promos 10:30–11:30 AM.
- Verticals
- Gaming/Entertainment: prime evenings and weekend afternoons; coordinate with drops/episodes.
- Education/Nonprofit: early mornings (habit-driven) and lunchtime.
- Health & Fitness: 6–9 AM (pre-work) and 5–8 PM (post-work).
---
Content Format Differences: Timing by Medium
Different formats index to different user mindsets and algorithmic signals.
- Short-form video (Reels, Shorts, TikToks)
- Strong in evenings and weekends when watch sessions are longer.
- Prioritize windows where your audience can watch with sound.
- Feed posts (static/carousels)
- Morning and lunchtime do well; carousels benefit from focused browsing.
- LinkedIn carousels: early morning for work-mode attention.
- Stories
- “Bookend” the day: post early morning to anchor, then 11 AM–1 PM and 5–8 PM for check-ins.
- Use stickers/polls during high-availability windows.
- Live streams
- Schedule for 30–60 minutes post-work (6–8 PM) or weekend late morning.
- Promote 24 hours ahead in the same daypart to train attendance.
- Link posts vs. native
- Links often underweight in reach; post when CTR likelihood is highest (midday) and support with Stories or replies.
---
Global Audiences and Time-Zone Strategy

For multi-region brands, winning timing is a routing problem, not a single answer.
- Segment by region and language
- Create audience clusters: AMER, EMEA, APAC; further split by EN/ES/FR/DE/JP, etc.
- Maintain region-specific queues with local copy and holidays.
- Follow-the-sun sequencing
- Publish the same core asset in waves: APAC morning, EMEA morning, AMER morning.
- Use 8–12 hour gaps to avoid back-to-back duplicates for overlapping followers.
- DST and weekend differences
- US and Europe shift DST on different weeks; pre-build DST variants in your scheduler.
- Weekend norms vary. Most countries: Sat–Sun. Many in MENA: Fri–Sat. Track your analytics, don’t assume.
- When to duplicate posts
- Safe: Evergreens, announcements, and trailers across regions with localized CTAs.
- Avoid: One-off reactive posts; instead, tailor to the local conversation.
---
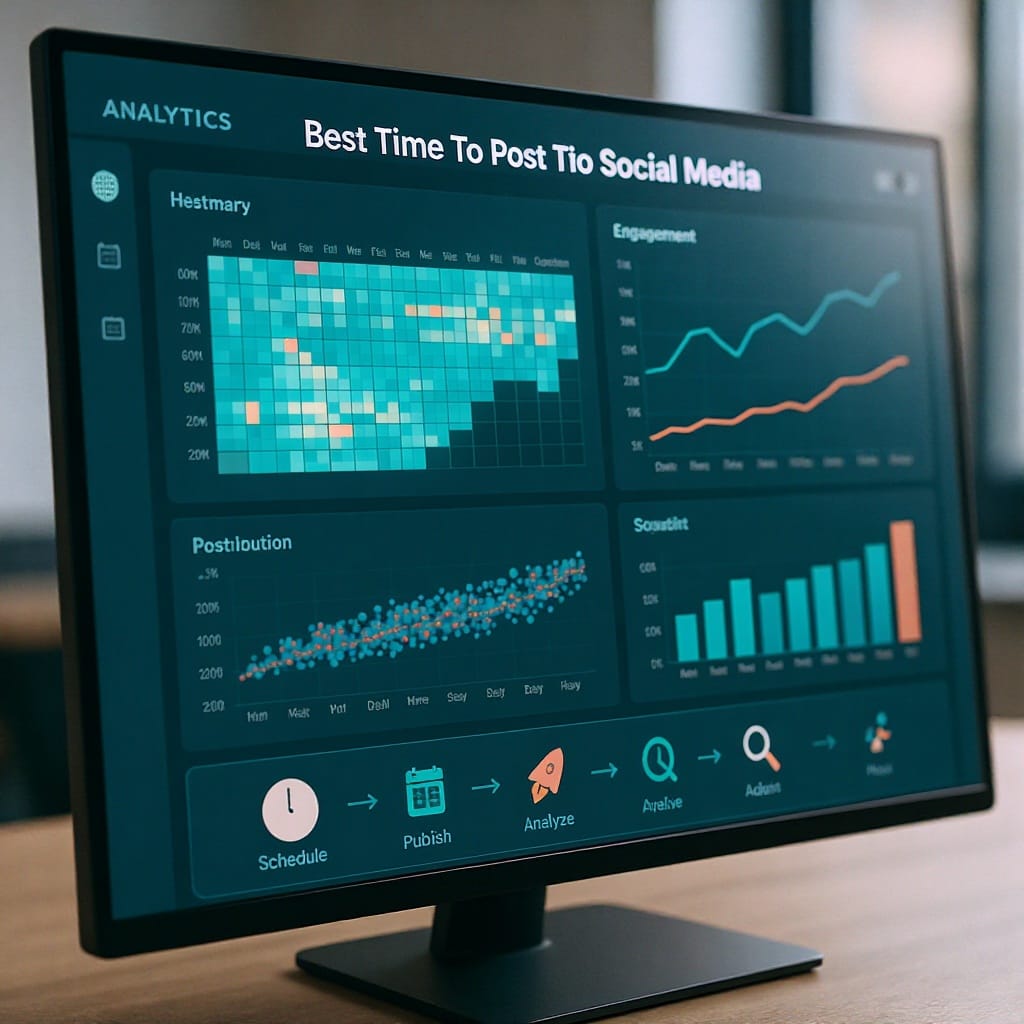
Find Your Best Time With Data
Start with platform-native analytics, then instrument clicks and conversions.
- Instagram: IG Insights → Total followers online by hour; Reels retention; Saves/Shares by post.
- TikTok: Analytics → Follower activity by hour and Top Territories; video watch time sources.
- YouTube: Studio → “When your viewers are on YouTube” heatmap; CTR and AVD by publish time.
- LinkedIn: Page Analytics → Follower demographics, update engagement by day/time.
Augment with GA4 and UTM-tagged links to connect timing to traffic and revenue.
- Use a consistent UTM schema with time-slot encoding in utm_content or utm_term.
https://example.com/offer?
utm_source=instagram&utm_medium=social&utm_campaign=2025-q1-launch
&utm_content=reel-slot-0900-tue- Map engagement by hour (local time) to outcomes:
- Session rate per impression
- Conversion rate and revenue per click
- Assisted conversions (if sales cycle is long)
Example GA4 BigQuery sketch (directional):
-- Aggregate sessions by UTM time slot and local hour
SELECT
  utm_source,
  utm_medium,
  utm_campaign,
  utm_content AS time_slot,
  COUNTIF(event_name = 'session_start') AS sessions,
  SUM(revenue) AS revenue,
  EXTRACT(HOUR FROM TIMESTAMP_MICROS(event_timestamp) AT TIME ZONE 'America/New_York') AS local_hour
FROM `project.dataset.events_*`
WHERE event_date BETWEEN '2025-01-01' AND '2025-03-31'
GROUP BY 1,2,3,4,7
Export to a spreadsheet and pivot sessions or revenue by local_hour to visualize your actual “best time to post to social media” by platform.
Pro tip: Normalize by reach or impressions to compare time slots fairly.
---
A Proven Experiment Framework
You don’t need moonshot statistics—just disciplined testing.
- Define candidate time blocks per platform
- Pick 3–5 windows based on benchmarks and analytics (e.g., 8:30 AM, 12:15 PM, 7:30 PM).
- Randomize and rotate
- Over 4–6 weeks, assign comparable posts to each slot in rotating order to avoid day-of-week bias.
- Control creative quality
- Keep topics, formats, and hooks as similar as practical across slots.
- Exclude boosted/paid posts from the analysis.
- Set sample sizes
- Aim for 15–30 posts per time slot per platform. If you post less frequently, extend the test window.
- Avoid seasonality traps
- Skip major holiday weeks. If unavoidable, tag them and analyze separately.
- Choose clear metrics
- Awareness: reach rate, 1-hour engagement velocity.
- Consideration: ER per reach, save/share rate, watch time.
- Action: CTR, landing page CVR, revenue per impression.
- Analyze significance
- Compare engagement rate or CTR across slots with a simple two-proportion z-test or Bayesian A/B.
Quick Python sketch:
from math import sqrt

## engagement rate comparison between slot A and slot B

clicks_a, impressions_a = 420, 10000
clicks_b, impressions_b = 365, 9500
pa, pb = clicks_a/impressions_a, clicks_b/impressions_b
p_pool = (clicks_a + clicks_b) / (impressions_a + impressions_b)
z = (pa - pb) / sqrt(p_pool*(1-p_pool)*(1/impressions_a + 1/impressions_b))
print('z-score:', z)

## |z| > 1.96 implies p < 0.05 (rough rule)
Interpret results pragmatically: even a small uplift at scale compounds.
---
Tools and Automation
Scheduling and reporting tools reduce busywork and enforce guardrails.
- Smart schedulers
- Buffer, Later, Hootsuite, Sprout Social: best-time suggestions, queues per region, bulk uploads.
- Native tools: Meta Business Suite, YouTube Studio, LinkedIn scheduling.
- Heatmaps and alerts
- Sprout/Buffer heatmaps for audience online times.
- Alerts for “spike windows” to piggyback on trending topics.
- Guardrails
- Frequency caps to avoid fatigue:
- Instagram: 3–7 feed posts/week + Stories most days; Reels 2–4/week.
- TikTok: 3–5 posts/week; quality beats volume.
- X: 1–3/day (more if news-driven).
- LinkedIn: 3–5/week on pages; 2–4/week on personal.
- YouTube: 1–2 long-form/week; Shorts 2–5/week.
- Pinterest: 1–3/day (fresh pins), more if you have deep catalog.
- Workflow integrations
- Use Notion/Asana for content calendars.
- Zapier to trigger reminders around embargoes or earnings/news cycles.
---
Build a Weekly Posting Schedule (Example)
Here’s a sample cadence to copy, then localize and test.
| Platform | Days | Primary Time | Secondary Time | Format Focus | Cross-Post Offset |
|---|---|---|---|---|---|
| Mon, Wed, Fri | 9:00 AM | 7:30 PM | Carousels + Reels | Threads +15 min | |
| TikTok | Tue, Thu, Sat | 8:00 PM | 8:00 AM | Short-form video | IG Reels next day AM |
| Tue, Thu | 8:30 AM | 12:15 PM | Carousel + Thought post | X +30 min summary | |
| X (Twitter) | Mon–Fri | 8:00 AM | 12:00 PM | Threads + Link | Repromote 6:00 PM |
| YouTube | Wed, Sun | 4:00 PM (publish) | — | Long-form + Shorts | Shorts 24h later |
| Daily | 9:00 PM | 11:00 AM (weekend) | Fresh pins | IG Story link next morning | |
| Threads | Mon, Wed, Fri | 9:15 AM | 6:30 PM | Conversational posts | IG post within 30 min |
Batch-produce assets on Monday, schedule through your tool, and leave a few “live” slots for newsjacking.
---
Advanced Tips and Pitfalls
- Myth-busting “lunchtime only”
- Lunchtime can be strong, but evenings often dominate for video and shopping. Test both.
- React to breaking news
- For X, Threads, and IG Stories, the best time to post to social media is when the conversation starts. Speed beats schedule.
- Holiday calendars
- Maintain regional holiday lists. If your audience is OOO, your post is too.
- Algorithm updates
- Watch for changes in link post reach, Reels distribution, or YouTube browse vs. suggested traffic. Your timing strategy may shift overnight.
- When to break your rules
- If you have a sticky hook and high audience affinity, post off-peak to own the feed. Less competition can mean more share of attention.
Key KPIs to track by time slot:
- Reach rate (reach/followers) and 1-hour velocity (engagements in first hour)
- ER per reach, share/save rate, profile actions per impression
- Video: average watch time, 50% retention point, completion rate
- Clicks, CTR, landing page CVR, revenue per 1,000 impressions
- YouTube: impression CTR and AVD in first 24 hours
30-60-90 day iteration plan:
- 0–30 days: Benchmark. Tag posts with time slots, build heatmaps, identify top 3 windows per platform.
- 31–60 days: Focus. Allocate 70% of posts to top 2 windows, 30% to challengers. Layer format-specific timing (e.g., Reels in evenings).
- 61–90 days: Scale and segment. Split schedules by region, add language variants, and test weekend vs. weekday for each format. Document new guardrails.

---
Putting It All Together
The “best time to post to social media” isn’t a single clock time—it’s a portfolio of time slots adapted to:
- Your audience’s regions and routines
- Your content formats and goals
- Your industry’s buyer journey
Use the directional windows here to get moving, then validate with analytics, UTMs, and the experiment framework. Within 60–90 days, you’ll have a defensible, data-backed schedule that reliably boosts early velocity and overall outcomes.
If you only do three things next week:
- Add time-slot tags to your UTMs.
- Pick three candidate windows per platform and rotate for two weeks.
- Build a simple heatmap and push 70% of posts into the top two slots.
That’s the fastest path to your true best time to post to social media in 2025.
---
Summary
- Timing still matters because early engagement signals drive distribution; use platform-specific windows as hypotheses.
- Segment by region, format, and intent, then validate with native analytics, UTMs, and a lightweight A/B test plan.
- Automate with schedulers, respect guardrails, and iterate on a 30-60-90 cadence to lock in your top-performing posting windows.


