Define Virality: What It Is, How It Spreads, and How to Measure It
Learn what virality really is, how it spreads, and how to measure it. Explore K-factor, R_t, algorithms, and tactics for ethical, scalable growth.

Define Virality: What It Is, How It Spreads, and How to Measure It


Virality is widely misunderstood as simple popularity; this guide clarifies what it truly is, how it propagates, and how to quantify and improve it. You’ll learn the core mechanics behind viral spread, the platform dynamics that amplify or throttle it, and the psychological triggers that motivate sharing. Use these principles to design ethical, high-velocity campaigns and convert spikes into durable growth.
Virality is not just “a lot of views.” To define virality precisely: it is a self-propagating, share-driven growth process in which each newly exposed person creates additional exposure by sharing, inviting, or remixing—without requiring proportional ongoing spend. Popularity can be purchased or broadcast; virality emerges when the audience becomes the distribution channel.
Virality is therefore about mechanics (how people share), motivation (why they share), and media-environment advantages (how platforms amplify sharing). When we define virality this way, we focus on reproducible levers rather than luck.
---
The Virality Coefficient (K-factor)
At the core of virality is the reproduction rate: how many new people each participant brings in. The most cited metric is the K-factor.
Formula and Intuition
K = i * c

where:
i = average number of share/invite attempts per user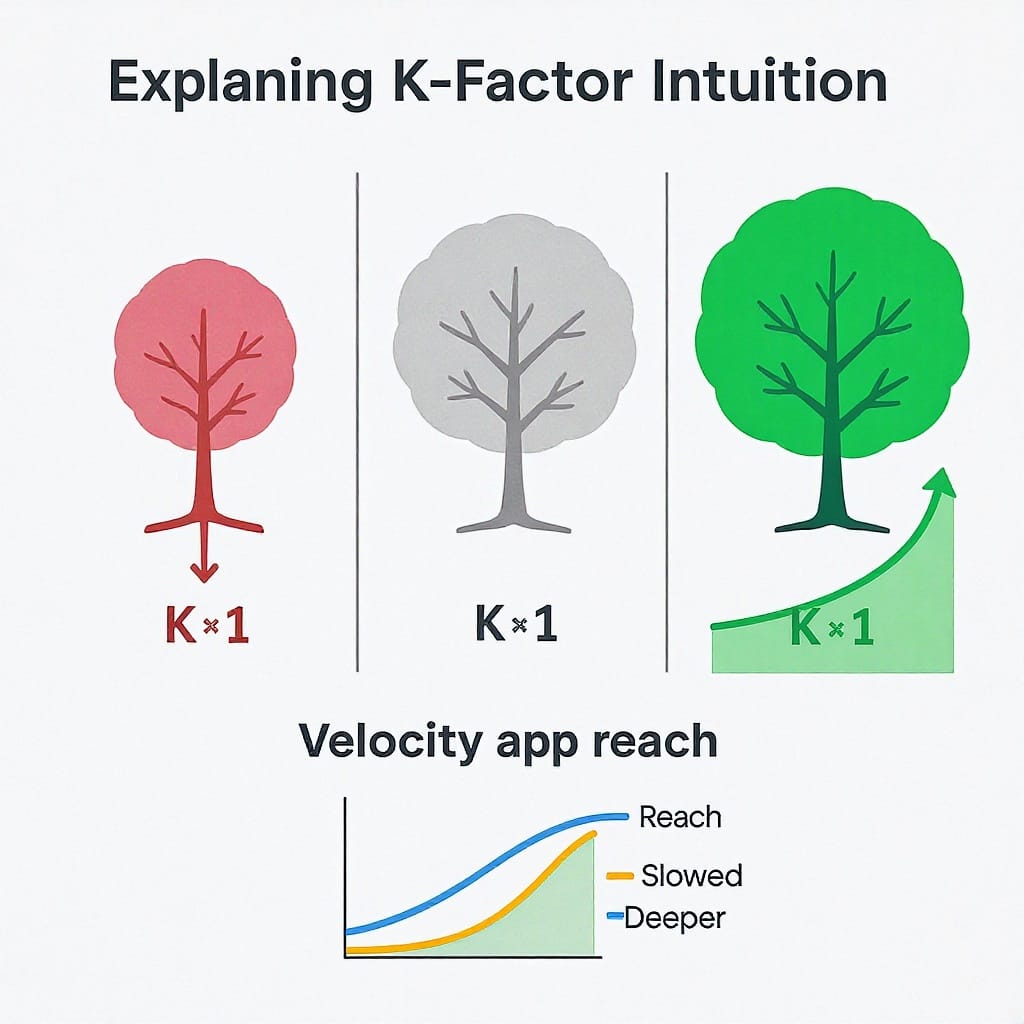
c = conversion rate per attempt (probability a recipient becomes an active sharer/viewer)- If K > 1, each “generation” of users is bigger than the last, creating exponential spread (at least for a period).
- If K = 1, growth is linear; spread sustains but doesn’t explode.
- If K < 1, the wave decays; you may still get a meaningful spike, but it tapers.
In practice, K is not static. It varies by cohort, by channel, and over time as novelty wanes and networks saturate. A more realistic framing:
K(t) = i(t) * c(t)
R_t  = K(t) adjusted for saturation and platform throttling
Where R_t (effective reproduction at time t) accounts for audience overlap, feed competition, and algorithmic distribution.
Why K > 1 Predicts Exponential Spread
When K > 1 for early generations, the cascade compounds rapidly:
- Generation 0: 100 seed users
- Generation 1: 100 * K
- Generation 2: 100 * K^2
- …
- Total reach ≈ seed * (1 - K^(g+1)) / (1 - K), where g is number of active generations before saturation
Even a small increase in K near 1 leads to outsized outcomes.
---
Velocity and Reach
Beyond K, virality is about speed and saturation.
- Time-to-peak (TTP): How quickly a piece reaches its highest daily views or shares. Faster TTP often correlates with stronger algorithmic amplification.
- Reproduction rate over time (R_t): Early R_t is crucial; platforms test early engagement to decide distribution.
- Network density: Tightly connected graphs (e.g., college campuses, niche communities) accelerate cascades but saturate faster.
- Early-mover effects: Being first to a new format or trend boosts novelty and platform favoritism.
A useful mental model: virality is a race between growth (driven by K and platform boost) and decay (fatigue, saturation, content half-life).
---
Platform Dynamics: Amplifiers and Throttles
Platforms are not neutral pipes. They actively shape propagation:
- Feeds and recommendations:
- “Cold start” tests with small samples; strong early engagement unlocks larger pools.
- Session-level personalization ranks content with high completion, rewatch, and reshare signals.
- Frictionless sharing:
- One-tap share, stitch/remix, duet, and native link unfurls reduce effort and increase i.
- Social graph vs. interest graph:
- Graph feeds spread within existing networks (high overlap).
- Interest feeds (e.g., TikTok’s For You) spread across weak ties (lower overlap, higher potential reach).
- Moderation and caps:
- Sensitive topics, suspected spam, or misleading metadata may be quietly downranked.
- Cross-network spillover:
- Screenshots and re-uploads carry virality across platforms, often changing the mechanics (and sometimes breaking attribution).
Design for the native mechanics of each platform: the share action, default audience, and recommendation triggers.
---
Psychological Triggers: Why People Share
Behind every viral curve is human motivation. Common triggers include:
- Emotion: High-arousal feelings—amusement, awe, anger—drive transmission.
- Novelty: New formats, insights, or twists earn attention and discussion.
- Utility: How-to’s, templates, and cheatsheets make people look helpful.
- Social currency: Sharing something first or rare signals taste, status, or insider knowledge.
- Identity and belonging: Content that aligns with group values or in-jokes spreads within communities.
- Practical friction: Short, scannable, captioned formats lower the cost of sharing.
Crafting for virality means embedding at least one strong trigger, then removing friction from the act of passing it on.
---
Formats That Travel
Certain formats are “born to run” because they compress value and invite remixing:
- Memes and image macros: Portable, low bandwidth, easy to localize.
- Short-form video: Strong loops, captions, and punchy hooks maximize completion and reshares.
- Challenges and prompts: Provide a simple template plus a social nudge to participate.
- Remixable assets: Green screens, templates, open audio, and duets make participation effortless.
- Interactive embeds: Quizzes, calculators, filters—when native to the platform—carry network effects.
Fit the format to the platform’s native behaviors: a tweet thread is portable on X, a sound trend thrives on TikTok, a linkable resource may do better on LinkedIn or newsletters.
---
Measuring Beyond Views
Views are a vanity metric if they don’t translate into propagation. To truly define virality, measure how attention begets more attention.
| Metric | What It Captures | How to Calculate / Notes |
|---|---|---|
| Share rate | Propensity to pass along | Shares / Impressions (platform-native); track per cohort and time bucket |
| Save/forward rate | Intent to revisit or relay later | (Saves + Forwards) / Impressions; strong leading indicator of algorithmic lift |
| Cascade depth | How many generations the content travels | Graph traversal over reshare chains; median and 95th percentile |
| Half-life | Time to 50% of total lifetime views | Faster half-life suggests spike-driven virality; slower can indicate durable reach |
| Uplift | Incremental impact vs. baseline | (Exposed - Control) / Control in experiments or geoholds |
| K-factor (effective) | Reproduction rate of spread | (Invites per user) * (Invite conversion); track as function of time and segment |
| S-curve diagnostics | Growth phase identification | Fit logistic curve to cumulative views; inspect inflection and saturation levels |
Quick Snippets
Compute half-life and S-curve fit hints:
half_life_hours = time_to_reach(0.5 * lifetime_views)

## Simple logistic fit (conceptual):

views_cum(t) = L / (1 + e^(-r * (t - t0)))

## L: carrying capacity, r: growth rate, t0: inflection point
Cascade depth (conceptual pseudo):
depths = []
for root in seeds:
    depths.append(max_distance_in_reshare_graph(root))
median_depth = median(depths)
---
Virality vs. Sustainable Growth Loops
Virality delivers spikes; sustainable growth delivers compounding. The best systems blend both.
- Referrals: A structured, incentive-aligned version of virality; track K_referral distinct from content K.
- Retention: Turning viral spikes into durable cohorts requires activation loops, habit hooks, and ongoing value.
- Compounding: Content libraries, SEO, and community flywheels layer durable acquisition on top of bursts.
- Paid seeding: Small spends can kickstart cold-start tests or reach key nodes. Use sparingly to boost early R_t without masking weak content-market fit.
A healthy model: seed → spike → capture (email, follows, sign-ups) → engage → convert → retain → prompt sharing again. Virality opens the door; growth loops keep people in the house.
---
Designing for Ethical Virality
The fastest path isn’t always the right one. Ethical design protects users and your brand:
- Avoid clickbait and misinformation; optimize for truthful clarity, not deceptive curiosity gaps.
- Don’t exploit outrage for its own sake; high-arousal emotions can harm communities.
- Respect consent and attribution in remix cultures; credit source creators and use open licenses where appropriate.
- Consider safety and well-being: content that could trigger harm or dangerous imitation should be redesigned or avoided.
- Define escalation rules: when to remove, correct, or de-amplify content that spreads unintended harm.
Ethical virality builds long-term trust, which in turn improves retention and the willingness to share.
---
A Teardown Framework: The Ice Bucket Challenge
Let’s analyze a classic: the 2014 Ice Bucket Challenge, which raised awareness and funds for ALS.
1) Triggers
- Emotion: Joy, mild fear (cold shock), altruism, and public accountability.
- Social currency: Participation signaled generosity and belonging.
- Novelty: A playful, time-bound dare with a physical payoff.
2) Mechanics
- Simple template: Dump ice water, record, donate, nominate three friends.
- Nomination loop: Clear branching structure—each participant creates multiple new participants.
- Public performance: Videos posted on Facebook and later cross-posted elsewhere; visibility incentivized participation.
- Time constraint: “Do it within 24 hours” increased urgency (velocity).
3) Metrics (inferred)
- High i: Most participants nominated multiple friends (i ≈ 2–3+).
- Strong c: Social pressure plus ease of participation likely pushed high conversion to action.
- K > 1 early: Resulted in rapid, global cascades with significant depth.
- Short TTP per locale but rolling peaks as the wave moved through networks.
- Measurable uplift: Donations and search interest spiked vs. baseline.
4) Platform Dynamics
- Facebook’s 2014 feed rewarded native videos and engagement; comments, tags, and reshares amplified distribution.
- Frictionless tagging and notifications increased visibility to nominees.
5) Transferable Lessons
- Provide a lightweight template and explicit call to propagate (nominate).
- Bundle purpose with play; people love to do good publicly when it’s fun.
- Bake in urgency to accelerate early R_t.
- Optimize for native platform behaviors (video, tagging, notifications).
- Enable cross-platform spillover to sustain waves after initial saturation.
6) Ethical Considerations
- Transparent donation mechanics and clear attribution to ALS organizations were crucial.
- Ensuring safety (e.g., avoiding risky stunts beyond ice water) mattered as imitators emerged.
---
Putting It All Together
To define virality rigorously:
- It’s a self-propagating system, not a raw view count.
- The K-factor and its time-varying behavior determine whether a wave explodes or fades.
- Velocity, network structure, and platform algorithms govern how far and how fast it travels.
- Human psychology and native formats make sharing likely and easy.
- Measuring share mechanics (not just reach) guides iteration.
- Sustainable growth loops convert spikes into lasting value.
- Ethical design guards trust and long-term brand equity.
If you want to engineer your next campaign for viral potential, start by writing down your assumed K, your early-engagement triggers, your platform-native mechanics, and your measurement plan. Then instrument ruthlessly, learn fast, and iterate with integrity.
Summary
Virality is a self-propelling distribution system shaped by reproduction dynamics (K), velocity, platform algorithms, and human motivation. Measure propagation quality—shares, conversion, cascade depth—rather than vanity views, and channel spikes into durable value through retention and growth loops. Plan deliberately, instrument thoroughly, and iterate ethically to compound trust and reach over time.