# Meituan Database Team Launches Database Capacity Evaluation System
The Meituan database team has developed a **Database Capacity Evaluation System** to address **capacity assessment challenges** and **prevent change-related risks**.
This system:
- Uses **online traffic replay** in a sandbox environment to verify the safety of database changes.
- Applies **accelerated replay** to detect cluster performance bottlenecks.
- Builds a **capacity management framework** for full-cycle observation and governance.
**Core strengths**:
**Safe data operations**, **reliable evaluation results**, and **flexible, efficient empowerment** — improving database stability and resource utilization.
---
## Contents
1. Project Background
2. Project Goals
3. Capability Overview
4. Traffic Replay
- Business Scenario
- Architecture Design
- Effect Display
5. Capacity Exploration
- Business Scenario
- Process Implementation
- Accelerated Replay
- Effect Display
6. Capacity Operations
- Business Scenario
- Operations Design
- Effect Display
7. Future Plans
---
## 1. Project Background
Databases are fundamental to modern business systems. As Meituan’s business scale grows, **database stability requirements** have reached all-time highs.
**Challenges faced by the team**:
### Pain Point 1 — Difficulty Evaluating Read/Write Capacity Limits
During peak activities, accurately assessing a database cluster’s capacity ceiling is challenging. This can lead to insufficient resources and production incidents.
**Current methods**:
- **Metric Calculation** — Compare load metrics to thresholds.
*Drawback:* Not strictly linear, reducing accuracy.
- **Full-Link Stress Testing** — Replay business traffic to find bottlenecks.
*Drawback:* Requires high integration complexity, may need service modifications.
---
### Pain Point 2 — Risk Detection in Database Changes
Database changes are a major source of online incidents.
**Current methods**:
- **Fixed-Rule Blocking** — Rules block unsafe changes.
*Drawback:* Cannot catch all performance-degrading changes.
- **Offline Testing** — Test changes in an offline setup.
*Drawback:* Differences with production data limit risk detection.
---
**Solution:** A unified **Database Capacity Evaluation System** that supports **real traffic replay**, **capacity probing**, and **automated capacity operations**.
---
## 2. Project Goals
To build a **scientific and practical capacity evaluation framework** that safely simulates real-world scenarios.
**Key requirements:**
1. **Data Operation Safety** — No disruption to online clusters during evaluation.
2. **Realistic Evaluation Results** — Fully simulated environments and traffic.
3. **Flexible, Efficient System** — Modular design allows plug-in integration into other systems.
---
## 3. Capability Overview
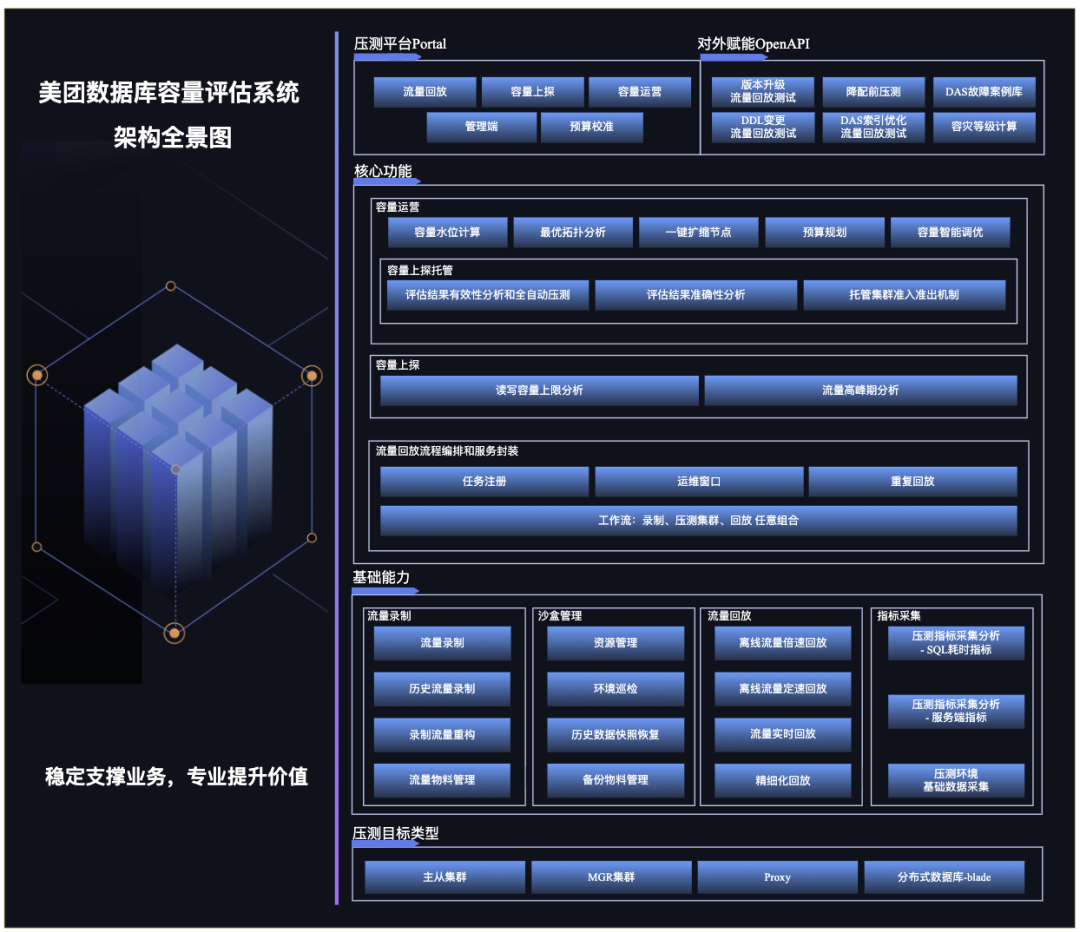
*Figure 1 – Capacity Evaluation System Panorama*
**Components**:
- **Stress Testing Platform** — User portal for traffic replay, capacity probing, and operations.
- **OpenAPI Interfaces** — External services can access replay capabilities.
- **Core Functions** — Traffic replay, capacity probing, capacity operations.
- **Modular Architecture** — Clear responsibility separation enables functional decoupling.
- **Protocol Adaptation** — Any SQL-protocol target can be adapted with minimal changes.
---
## 4. Traffic Replay
Traffic replay ensures **accurate evaluation** by replaying production traffic into a sandbox environment.
### 4.1 Business Scenario

Frequent database changes — parameter tuning, slow query optimization, version upgrades — carry operational risk. Traffic replay helps evaluate these safely.
---
### 4.2 Architecture Design
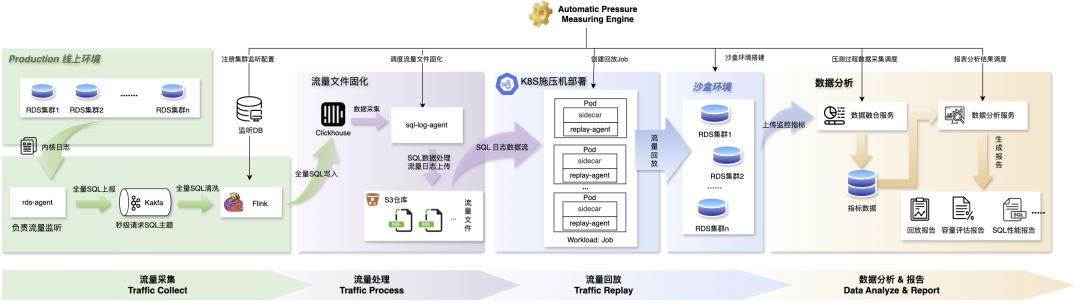
**Figure 2 — Traffic Replay Flow Diagram**
**Replay Pipeline**:
#### Traffic Collection
1. **Data Collection** — MTSQL engine captures SQL, txn IDs, execution duration, sent to Kafka via `rds-agent`.
2. **Data Cleaning** — Flink filters SQL for replay clusters.
3. **Data Storage** — Structured SQL stored in ClickHouse for orchestration.
#### Traffic Processing
1. **Aggregation** — `sql-log agent` scans SQL for replay clusters.
2. **Processing** —
- Master nodes → Transaction-level aggregation.
- Replica nodes → SQL-level separation.
3. **Solidification** — Saved as traffic files, uploaded to S3.
#### Traffic Replay
1. **replay-agent** — Streams traffic from S3 into sandbox clusters.
2. **Load Deployment** — Packaged into Kubernetes jobs, supporting elastic scaling.
3. **Sandbox Environment** — Snapshot at replay start + change window for simulated upgrades.
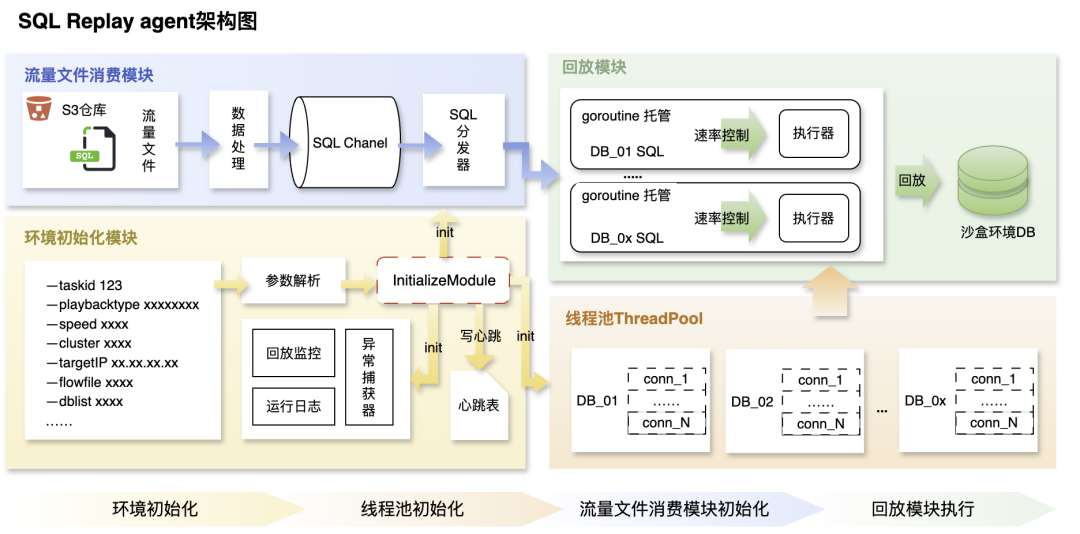
**Figure 3 — SQL Replay Agent Architecture Diagram**
#### Data Analysis & Reporting
Collects multi-dimensional metrics:
- CPU usage, load averages, slow queries, replication lag.
- SQL execution latency by template.
- MySQL parameters & instance specs.
---
### 4.3 Effect Display
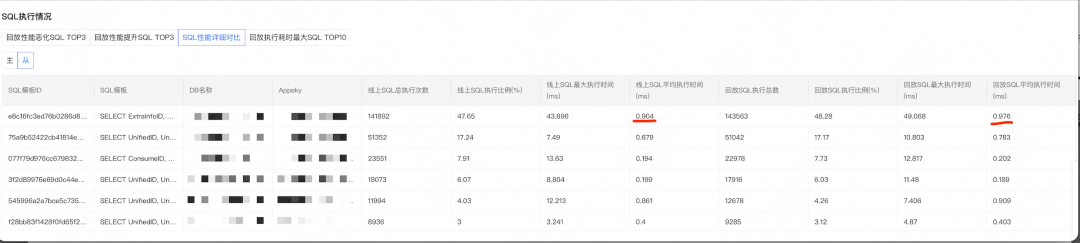
*Figure 4 — SQL Execution Comparison*
Example:
After enabling table compression, top SQL latency increased slightly, but storage usage dropped to 40%. Change was applied to production with stable performance.
---
## 5. Capacity Exploration
Beyond replaying at **1× load**, exploration determines the **maximum QPS** a cluster can handle.
### 5.1 Business Scenario

---
### 5.2 Process Implementation
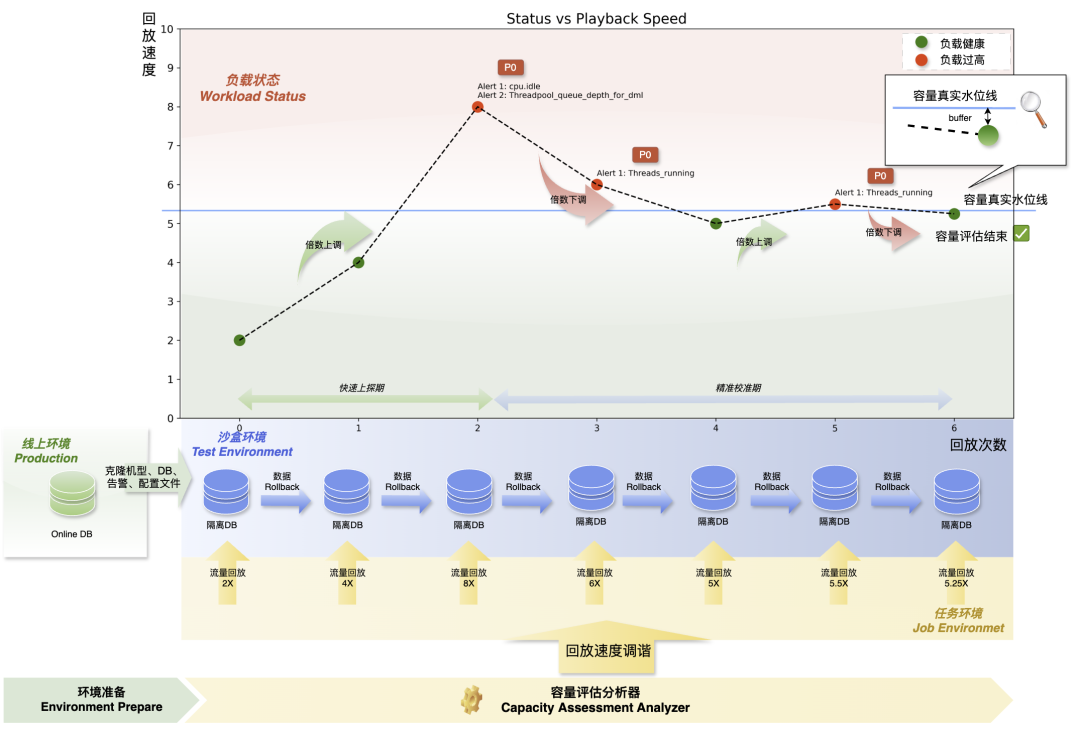
*Figure 5 — Capacity Exploration Process*
**Steps**:
1. **Peak Traffic Sampling** — Collect business peak traffic.
2. **Iterative Accelerated Replays** — Adjust replay speed until hitting capacity.
**Overload Criteria:** Alerts triggered during replay indicate overload.
**Sandbox Setup:** Match configuration to production for accuracy.
---
### 5.3 Accelerated Replay
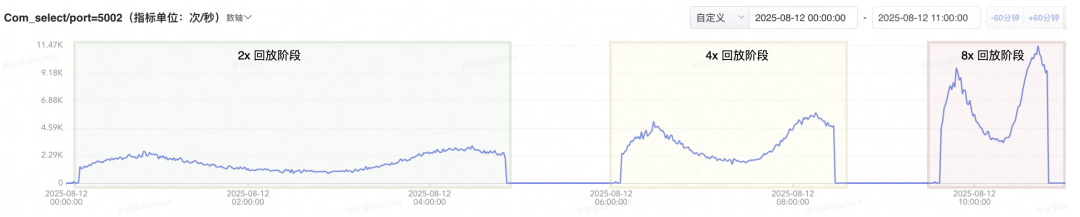
*Figure 6 — QPS Increase Illustration*
Shorter execution intervals → higher concurrency → increased load.
**Timing Control Mechanism**:
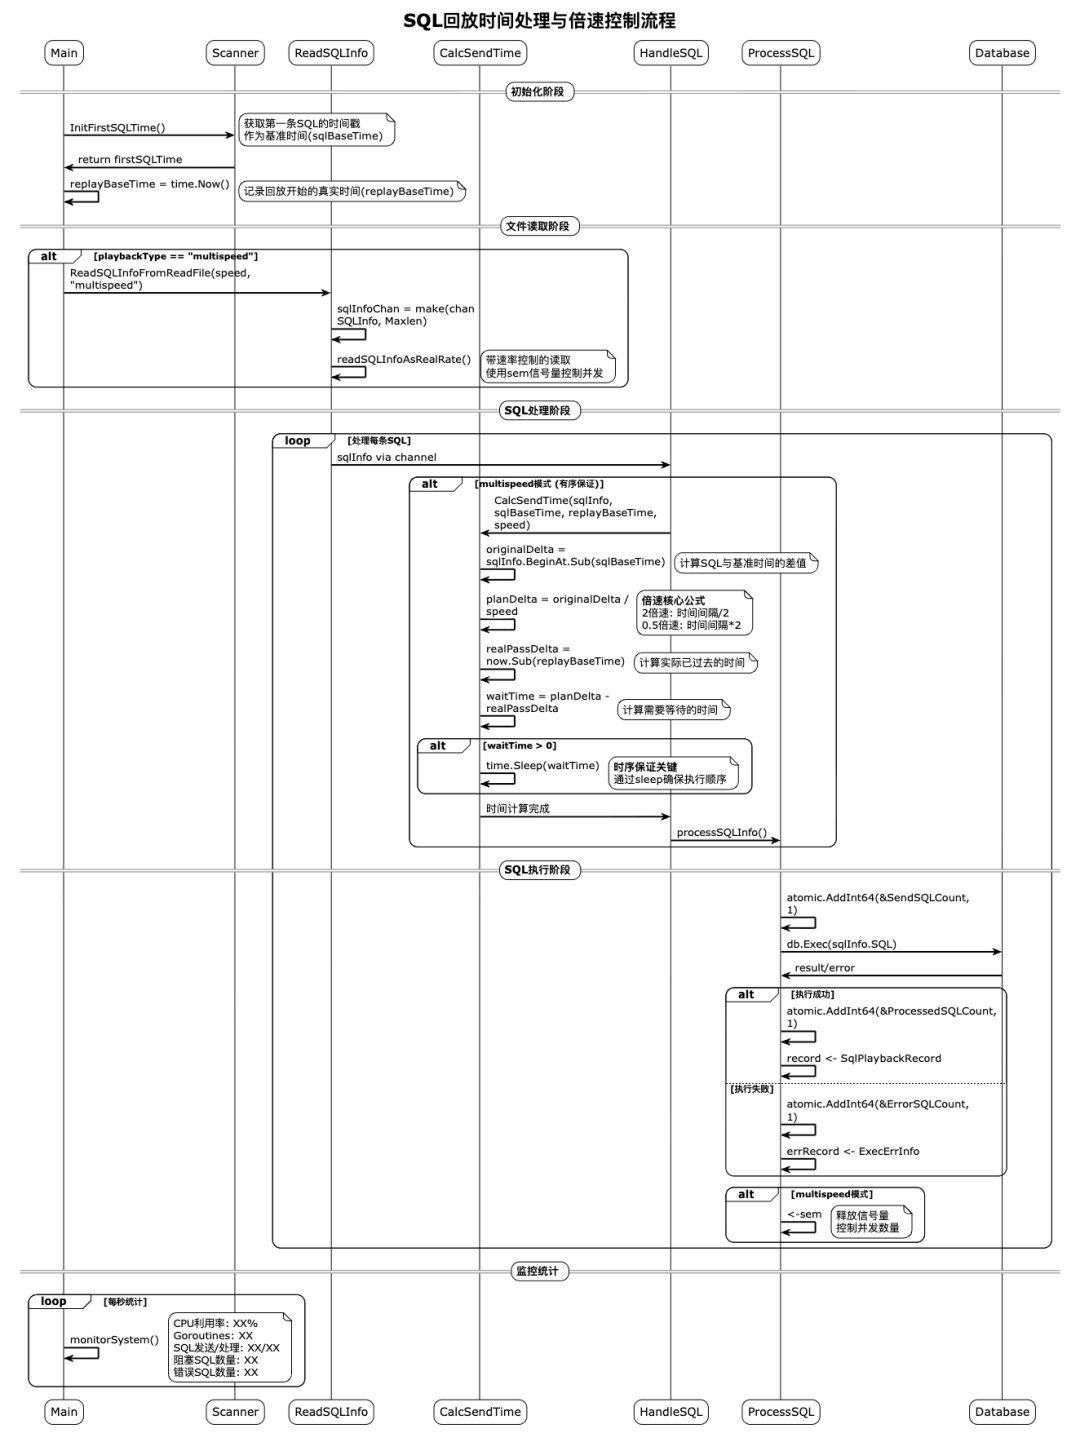
*Figure 7 — Playback Timing Flow*
1. Calculate offset from replay start (`originalDelta`).
2. Adjust based on target speed (`planDelta`).
3. Prefetch SQL asynchronously.
4. Compare planned vs. actual, adjust execution timing.
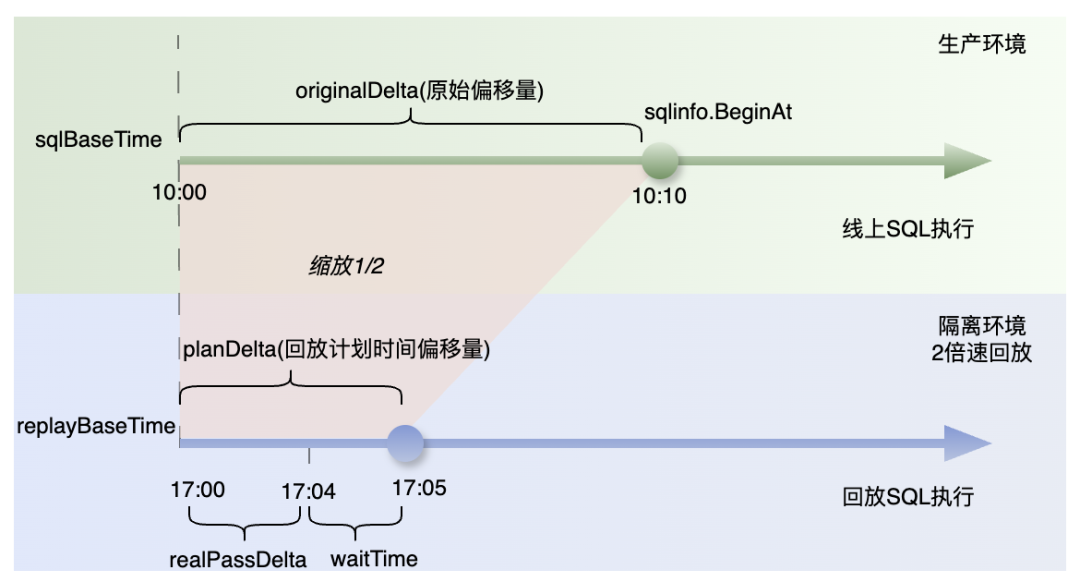
*Figure 8 — SQL Timing Illustration*
---
### 5.4 Effect Display
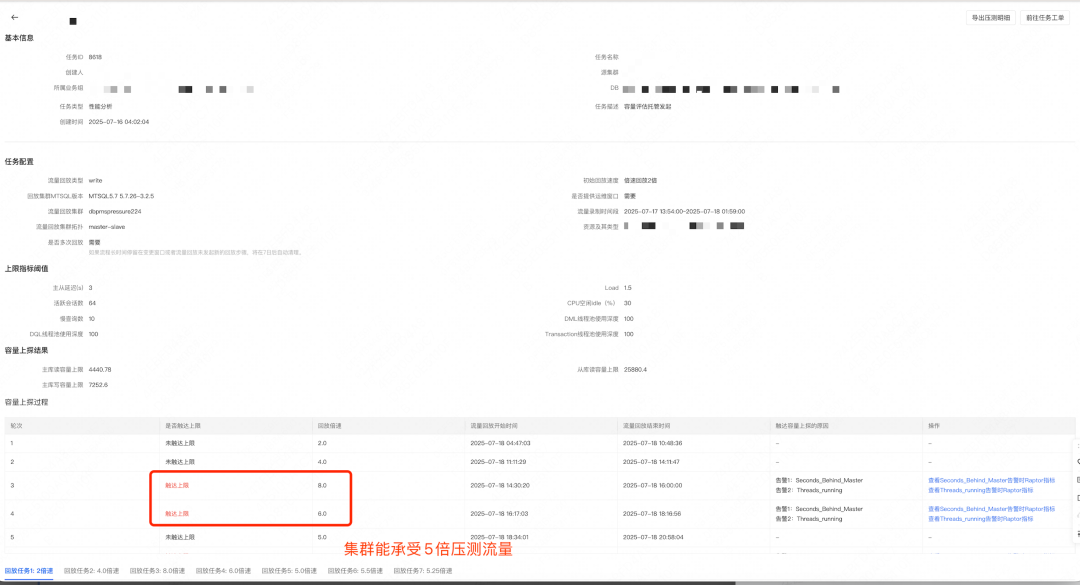
*Figure 9 — Capacity Stress Test Report*
Example:
Cluster downgraded after finding it could handle >6× traffic before overload — exceeding 2× target.
---
## 6. Capacity Operations
Real-time **capacity monitoring and optimization** for production clusters.
### 6.1 Business Scenario

DBAs assess whether clusters face bottlenecks or have surplus capacity — critical before major events.
---
### 6.2 Operations Design
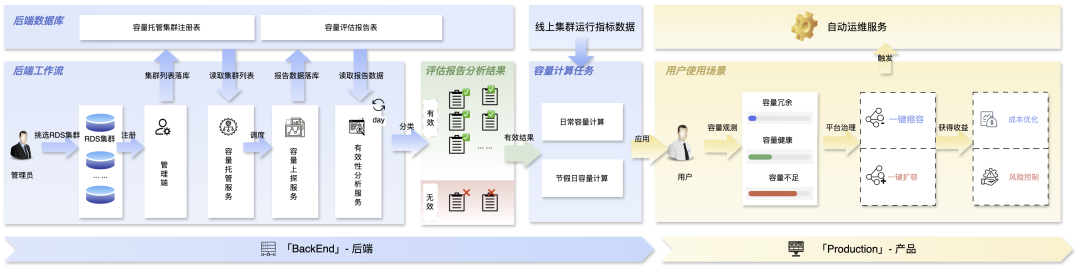
**Figure 10 — Capacity Operations Architecture**
**Modules**:
1. **Evaluation Hosting** — Automated replay & probing for registered clusters.
2. **Capacity Calculation** —
- Usage level = Online QPS / Probed QPS limit.
- Recommendations for downsizing or expansion.
3. **Automated Operations** — One-click execution with rollback and observability.
---
### 6.3 Effect Display
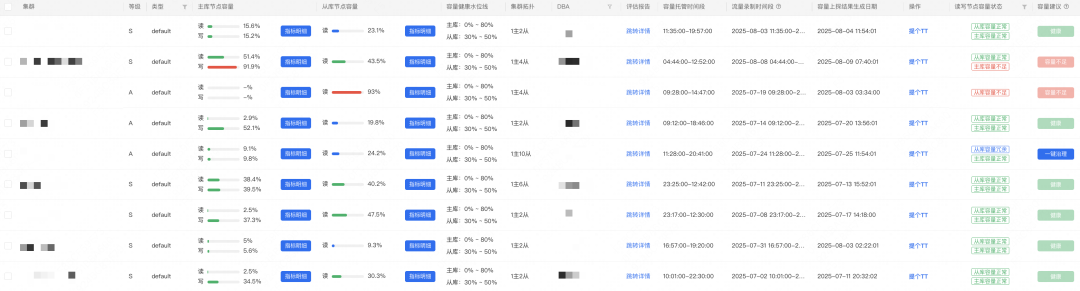
*Figure 11 — Capacity Usage Report*
Dashboard shows capacity levels and recommendations.
DBAs use this for expansions, splits, or downgrades.
---
## 7. Future Plans
1. **Support More Databases** — MGR, Proxy, Blade, Elasticsearch, and more.
2. **Budget Planning Tools** — Based on evaluation data to optimize resource allocation.
3. **Intelligent Optimization** — Bottleneck detection, automated retesting of improvements.
4. **Case Library** — Save real incident and promotion scenarios for future chaos engineering tests.
---
**Summary:**
Meituan’s **Database Capacity Evaluation System** provides **safe, accurate, and flexible** replay-based evaluation, capacity probing, and operational automation — enhancing **performance stability** and **resource efficiency** across large-scale database clusters.