Key Twitter Performance Metrics to Track for Growth
Learn key Twitter performance metrics like engagement rate, follower growth, CTR, and hashtag reach to optimize campaigns and drive platform growth.

Understanding Twitter Performance Metrics
Twitter performance metrics are crucial indicators that help marketers and social media managers measure the success of their Twitter marketing strategy. By analyzing these metrics, you can determine how well tweets are performing, understand audience behavior, and optimize campaigns for better ROI. These insights are essential for businesses aiming to grow their presence on Twitter, assess engagement quality, and benchmark against competitors.
Monitoring Twitter performance metrics is important because:
- They reveal audience preferences and interaction trends.
- They guide content optimization for higher engagement.
- They help demonstrate return on investment to stakeholders.
- They offer competitive insights through benchmarking.
By consistently tracking the right KPIs, marketing teams can spot trends, highlight successes, and correct underperforming areas before they affect long-term growth.
---
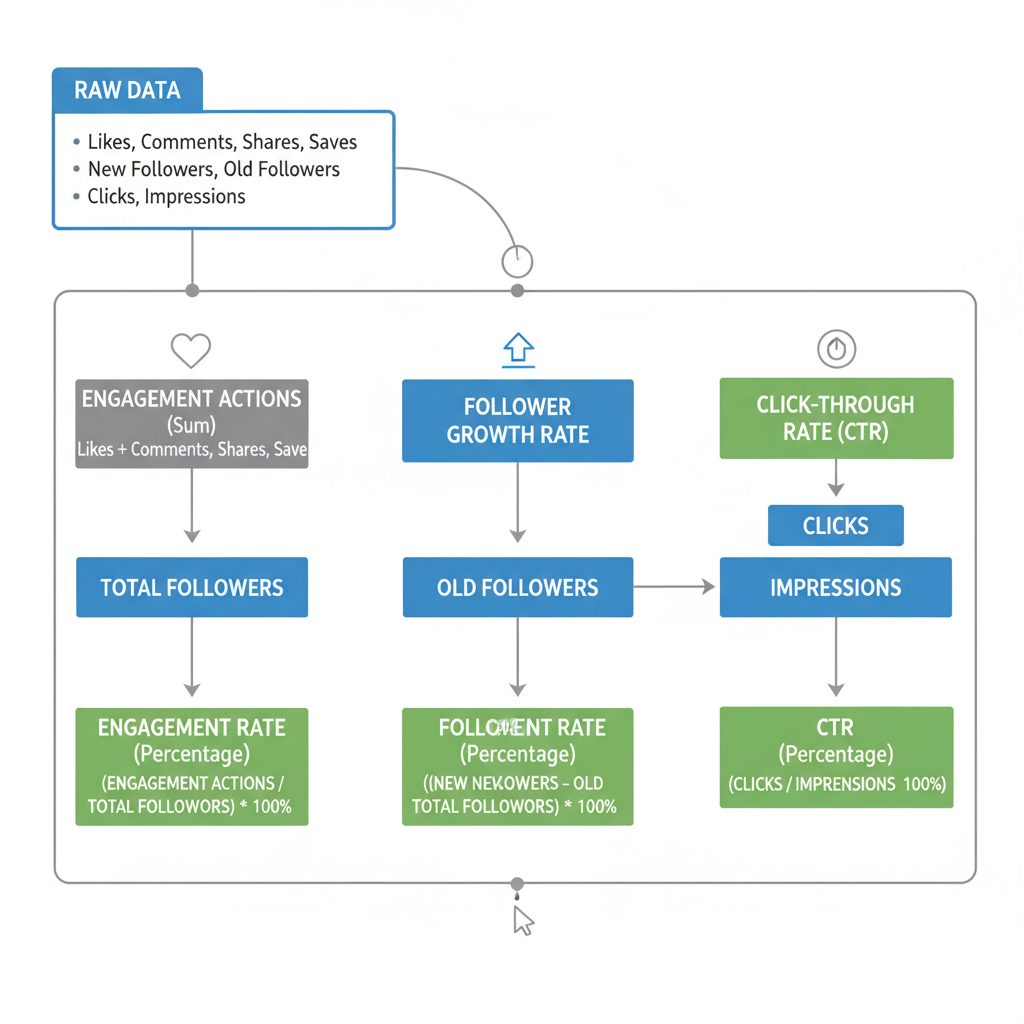
Engagement Rate: Calculation and Benchmarks
Engagement rate measures how actively users interact with your tweets — including likes, retweets, replies, and clicks. A strong engagement rate is often a sign that your content resonates well with the audience.
Engagement Rate (%) = (Total Engagements / Total Impressions) × 100Where:
- Total Engagements = sum of likes, retweets, replies, profile clicks, media views, and link clicks.
- Total Impressions = number of times users saw your tweet.
Industry Benchmarks
| Industry | Average Engagement Rate (%) |
|---|---|
| Retail | 1.25 |
| Tech | 0.80 |
| Media & Entertainment | 1.50 |
| B2B Services | 0.60 |
Knowing industry benchmarks helps you evaluate your performance in context and set achievable targets.
---
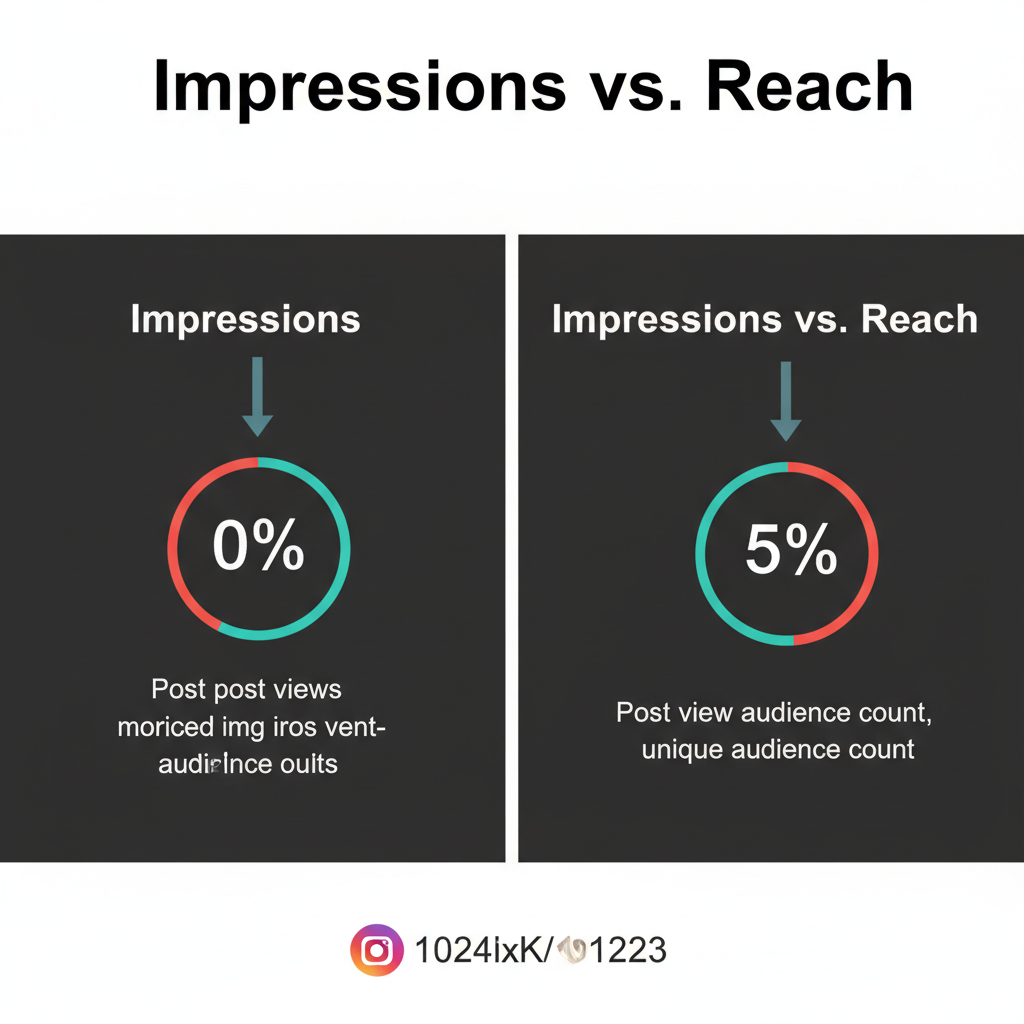
Impressions vs Reach
Marketers often confuse impressions and reach, but they measure different aspects of visibility:
- Impressions: The total number of times your tweet appears in users’ timelines or search results.
- Reach: The unique number of users who have seen your tweet.
Tip: High impressions alongside stagnant reach may indicate repetitive exposure to the same audience. Aim for balance to maximize brand visibility.
---
Follower Growth Rate
Follower growth rate evaluates how quickly your Twitter audience expands relative to your total followers.
Follower Growth Rate (%) = (New Followers / Starting Follower Count) × 100Track follower growth alongside engagement quality. Rapid growth with minimal interaction may suggest followers are not genuinely interested, prompting refinement in targeting.
Best Practices:
- Partner with influencers in your niche.
- Create campaigns with incentives.
- Engage directly with potential followers to establish rapport.
---
Click-Through Rate (CTR)
CTR measures the percentage of users who click a link in your tweet after viewing it, offering valuable insight into traffic-driving content.
CTR (%) = (Link Clicks / Impressions) × 100Boost CTR by:
- Crafting compelling headlines.
- Using clear calls-to-action.
- Incorporating eye-catching visuals.
---
Hashtag Performance
Understanding hashtag performance enables content discovery and targeted engagement.
Metrics to Track
- Hashtag reach: Unique users exposed to tweets with the hashtag.
- Hashtag impressions: Total times the hashtag appeared in feeds.
- Engagement driven by a hashtag: Interactions generated through its use.
Optimization Tip: Combine trending hashtags with branded hashtags to enhance visibility and reinforce identity.
---
Video Views and Completion Rate
Videos can drive higher engagement, but completion rates are key indicators of relevance.
- Views: Number of times the video was watched.
- Completion Rate (%):
Completion Rate = (Users who watched full video / Total viewers) × 100
Increase completion rates by:
- Keeping videos short and concise.
- Creating an engaging hook early.
- Adding captions for accessibility.
---
Top Tweets Analysis
Top tweets represent your best-performing posts. Studying them reveals what content works best.
Steps
- Sort tweets by the metric of interest (engagement, impressions, CTR).
- Identify elements contributing to success — tone, format, timing.
- Implement these findings in future posts while adding fresh angles to avoid audience fatigue.
---
Profile Visits and Mentions
Profile visits highlight interest in your brand or persona. Mentions are direct references to your handle, often indicating active engagement.
Spikes in visits often precede follower growth, while increased mentions may accompany viral content or influencer endorsements. Leveraging these signals lets you deepen connections with your audience.
---
Best Tools for Monitoring Twitter Metrics
Monitoring and reporting tools give structured visibility into performance metrics:
| Tool | Type | Key Features |
|---|---|---|
| Twitter Analytics | Free | Native metrics, top tweets, follower trends |
| Hootsuite | Paid | Custom reports, platform integration, scheduling |
| Buffer | Paid | Engagement analytics, posting time suggestions |
| Brandwatch | Paid | Sentiment analysis, competitor tracking |
| SocialPilot | Paid | Bulk scheduling, advanced analytics |
---
Setting SMART Goals Based on Metric Insights
Metrics deliver value only when linked to strategic goals. Use the SMART framework:
- Specific: Define the objective clearly (e.g., raise CTR by 15% in 3 months).
- Measurable: Metrics must quantify progress.
- Achievable: Set realistic expectations based on current data.
- Relevant: Align metrics with overall marketing objectives.
- Time-bound: Set deadlines for accountability.
---
Common Mistakes in Analyzing Twitter Data
Avoid these errors when interpreting metrics:
- Overvaluing vanity metrics without engagement context.
- Ignoring industry context when comparing data.
- Reacting to one-off spikes without trend analysis.
- Neglecting qualitative inputs like sentiment from comments.
---
Actionable Tips to Boost KPIs
- Publish during peak engagement times identified via analytics.
- Incorporate multimedia for higher visibility.
- Test different tweet lengths to find the optimal format.
- Engage proactively with replies and mentions.
- Run A/B tests with different CTAs and headlines.
- Monitor competitors for inspiration and differentiation.
---
Summary and Next Steps
By consistently monitoring and refining Twitter performance metrics — such as engagement rate, CTR, follower growth, and hashtag impact — marketers can develop more effective campaigns, strengthen audience relationships, and achieve measurable growth. Start capturing these data points today to fine-tune your Twitter strategy and propel your brand towards sustained social media success.
Call-to-Action: Begin analyzing your Twitter metrics using at least one recommended tool, set SMART goals, and watch your KPIs climb.