Create a Facebook Report Template to Track Key Metrics
Learn how to build a Facebook report template to centralize key metrics, track performance trends, and make data-driven marketing decisions.

Create a Facebook Report Template to Track Key Metrics
In today’s data-driven marketing world, Facebook remains one of the most powerful platforms for reaching and engaging audiences. Whether you manage organic content, paid ads, or both, having a Facebook report template lets you centralize essential metrics, identify performance trends, and make smarter marketing decisions. With a consistent and clear reporting framework, you can spend less time chasing numbers and more time refining strategies that drive results.

---
What Is a Facebook Report Template and Why It Matters
A Facebook report template is a pre-structured document—often in spreadsheet or dashboard form—that organizes your core Facebook analytics into a consistent, repeatable format.
It’s important for marketers because it:
- Saves time by avoiding repetitive setup.
- Enables consistent performance tracking.
- Makes sharing insights with stakeholders easier.
- Reduces the chance of overlooking key metrics.
A thoughtfully designed template turns raw data into actionable intelligence.
---
Key Metrics to Include in Your Facebook Report Template
Your chosen metrics should reflect your campaign objectives. However, most Facebook marketing reports benefit from monitoring these baseline KPIs:
- Reach – Unique users who viewed your post or ad.
- Engagement – All interactions including likes, comments, shares, and reactions.
- Clicks – Link clicks or other actionable clicks related to your goals.
- Conversions – Actions that match business goals, like signups or purchases.
Additional useful data points include:
- Impressions
- Cost per result
- Video views and average watch time
- Posting frequency
| Metric | Definition | Why It Matters |
|---|---|---|
| Reach | Unique users who saw your content | Measures audience size and distribution |
| Engagement | Interactions like likes, comments, shares | Reflects audience interest and relevance |
| Clicks | Number of clicks generated by your content | Indicates traffic-driving ability |
| Conversions | Completed actions that meet business goals | Directly linked to ROI and objective success |
---
Set Clear Reporting Goals
Defining the purpose of your report is essential. Are you aiming to:
- Measure brand awareness?
- Increase website traffic?
- Grow product sales?
- Enhance community engagement?
Having a clear objective determines the KPIs to emphasize and the narrative your report will convey.
---
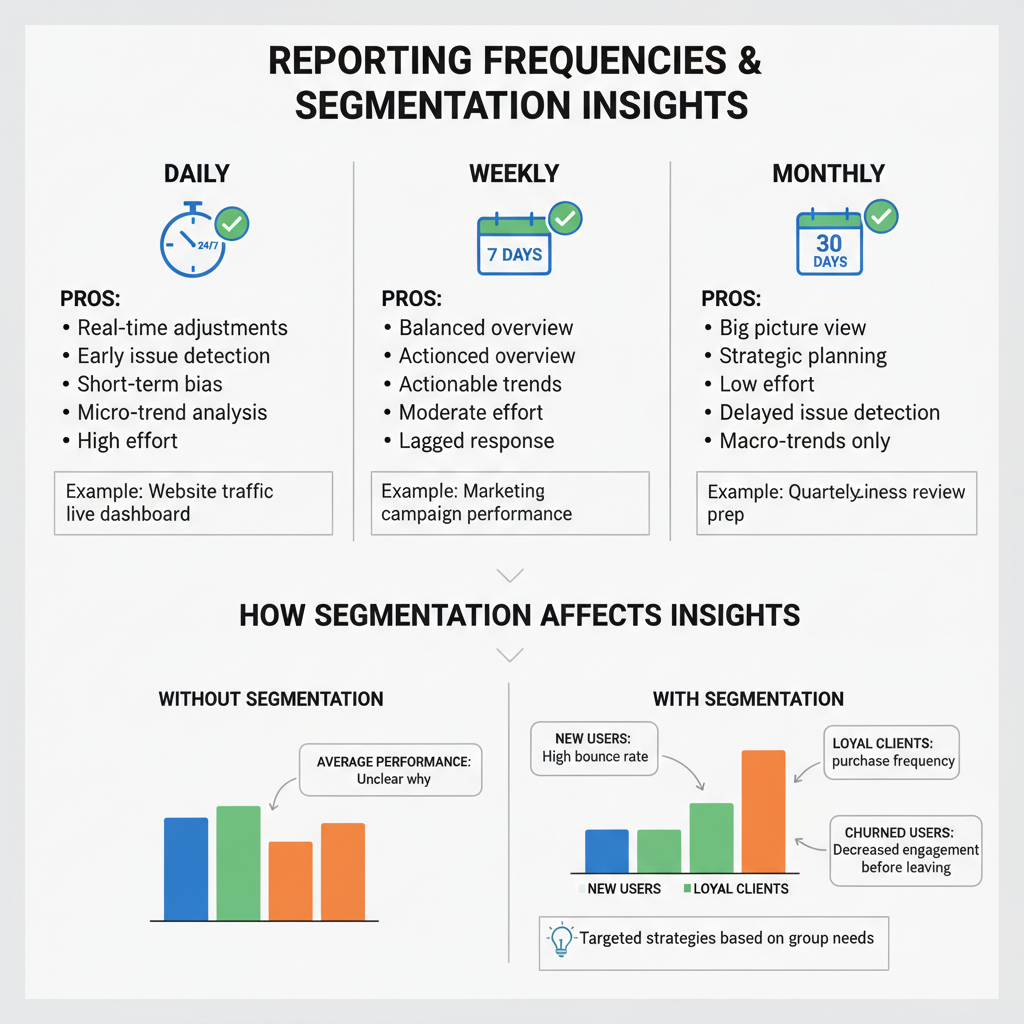
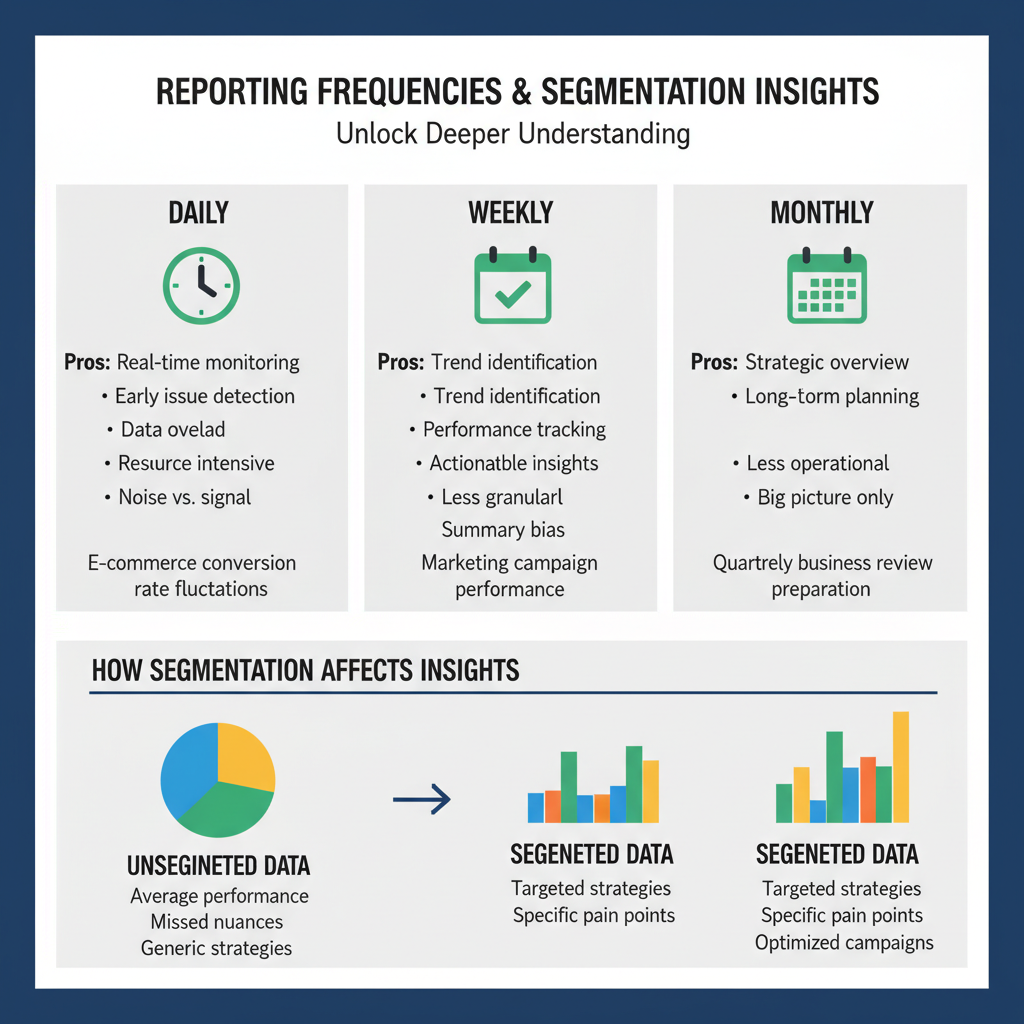
Choose Your Reporting Frequency
To detect trends reliably, pick a schedule and stick to it:
- Weekly – Ideal for fast-moving campaigns or agile testing.
- Monthly – Balances detail with big-picture analysis.
- Campaign-based – Tracks performance for specific initiatives.
---
Select the Right Data Sources
Accurate insights come from dependable data. Key tools include:
- Facebook Insights – For organic performance, audience demographics, and post analytics.
- Ads Manager – For paid campaign results, CPC, and conversion data.
For advanced reporting, platforms like Google Data Studio or third-party connectors such as Supermetrics can integrate data from multiple sources.
---
Design a Simple, Reusable Structure
A strong Facebook report template should:
- Put top KPIs in the first section.
- Label metrics and periods clearly.
- Group related insights together.
- Use consistent date formats and units.
Starting with Google Sheets, Excel, or a BI dashboard ensures ease of replication.
---
Segment Your Data
Breaking down your data offers deeper insight:
- By Campaign – Highlights top-performing initiatives.
- By Audience – Age, gender, or location breakdowns reveal targeting effectiveness.
- By Content Type – Compare videos, images, and text posts to refine creative strategy.
---
Add Visual Elements for Quick Interpretation
Graphical representation helps stakeholders digest complex information:
- Bar or column charts for comparative KPIs.
- Line graphs to illustrate growth or decline patterns.
- Pie charts for audience composition or content proportion.
---
Include Benchmarks and Performance Targets
Performance data is more valuable when measured against context:
- Historical averages.
- Competitor performance (when available).
- Specific campaign goals.
Benchmarks help determine whether results are meeting, exceeding, or falling short of expectations.
---
Automate Data Collection Where Possible
Automation enhances accuracy and efficiency:
- Leverage the Facebook Graph API for direct data pulls.
- Use integration tools like Supermetrics or Zapier to feed dashboards.
- Schedule automated Ads Manager exports to email.
Example API Endpoint:
GET /v15.0/{page-id}/insights?metric=page_impressions,page_engaged_users
---
Customize for Client vs. Internal Reporting
Different audiences require different reporting styles:
- Client-facing – Focus on outcomes, visuals, and summaries.
- Internal teams – Include detailed breakdowns for optimization.
Tailoring the same base data to the right level of detail increases relevance and comprehension.
---
Common Mistakes to Avoid
Pitfalls to sidestep in your Facebook reports:
- Tracking excessive metrics that dilute insights.
- Using inconsistent date ranges for datasets.
- Presenting data without analysis or recommendations.
- Omitting negative results to create a false picture.
---
Analyze the Report for Actionable Insights
When your template is populated:
- Identify the top three wins and underperforming areas.
- Review engagement, CTR, and conversion drivers.
- Compare ad spend to ROAS.
- Highlight content types that outperform others.
The goal is to transform numbers into decisions.
---
Continuous Template Improvement
Your Facebook report template should adapt with your marketing approach:
- Review KPIs quarterly.
- Evaluate if visuals clearly tell the performance story.
- Adjust automation as tools and APIs evolve.
- Consider feedback from both internal teams and clients.
---
Summary and Next Steps
A clear, well-structured Facebook report template doesn’t just collect data—it reveals the story behind your marketing performance. By defining goals, choosing the right metrics, visually presenting insights, and streamlining data collection, you empower your team to focus on strategy over manual reporting.
Start building your template today, customize it for each project, and refine it regularly to ensure your Facebook marketing campaigns consistently deliver measurable results.