Using Facebook Share Analytics to Increase Post Engagement
Learn how to use Facebook share analytics to interpret audience behavior, identify high-performing content, and boost post engagement strategically.

Introduction to Facebook Share Analytics and Why It Matters
Social media is a powerful driver of brand awareness, audience engagement, and conversions. On Facebook, one of the most significant actions a user can take is to share your content. Shares not only expand your post’s reach beyond your immediate followers but also add a level of social proof — when people share a post, they implicitly endorse it to their own network.
Facebook share analytics focuses on measuring and interpreting how often and why your content is shared. For brands, marketers, and creators, understanding these metrics can lead to smarter content decisions, higher engagement, and improved campaign ROI. This guide will walk you through where to find share metrics, how to interpret them, and how to use them to refine your strategy.
---
Overview of Facebook Insights: Where to Find Share-Related Data
Facebook provides a built-in analytics dashboard called Facebook Insights. This tool gives you access to a wide range of performance metrics for your posts, including shares.
To find share-related data:
- Go to your Facebook Page.
- Click on Insights in the left-hand menu (for classic Pages) or access the Meta Business Suite (for new Pages).
- Under Content or Posts, view performance metrics for each post, including the number of shares.
- Use the date filter to examine specific time ranges.
You can export your analytics into a CSV file for deeper analysis or integrate them with other reporting tools.
---
How to Interpret Share Metrics
When you look at shares in Facebook Insights, you’re not just counting raw numbers — you can extract meaning by viewing them alongside other metrics such as:
| Metric | What It Means | Why It Matters |
|---|---|---|
| Reach | The number of unique users who saw your post. | High reach with low shares may indicate content is not compelling enough to spread. |
| Clicks | The number of times users clicked links, media, or calls to action in the post. | Shows engagement depth; when combined with shares, you see both breadth and depth. |
| Engagement Rate | Percentage of people who interacted with the post (likes, comments, shares, clicks) out of total reach. | Higher engagement rates signal more resonance with the audience. |
Tip: A post with a moderate reach but high share ratio can be a “hidden gem” worth boosting via paid promotion.
---
Identifying Top-Performing Content Based on Shares
Sorting your posts by the number of shares quickly reveals your most viral or shareable content. This process helps you:
- Detect patterns in successful posts (tone, topic, format).
- Recognize which visuals or calls-to-action drive sharing.
- Replicate proven elements in future campaigns.
Example: A short, positive video might consistently outperform stock photo posts — prompting a shift toward more native video creation.
---
Understanding Audience Demographics and Behavior from Share Data
Facebook Insights also lets you break down post engagement by demographics:
- Age and gender segmentation shows who is resonating most with your content.
- Location data can guide region-specific content creation.
- Device usage insights indicate whether to optimize for mobile or desktop experiences.
When correlated with share counts, these demographics help you build audience personas that embody your most effective sharers.
---
Tracking Share Performance Over Time and Spotting Trends
Tracking shares over weeks and months allows you to:
- Identify seasonal peaks in engagement (e.g., holidays, industry events).
- See if certain days or times correlate with more shares.
- Monitor the effects of content strategy changes.
Best practice: Maintain a spreadsheet or dashboard that compiles share counts alongside other engagement metrics for each post date. This longitudinal view is essential for making informed, data-driven decisions.
---
Using Share Analytics to Refine Content Strategy
By analyzing share metrics, you can improve the timing, format, and topics of your posts:
- Timing: Post during hours when your audience is online and more likely to share.
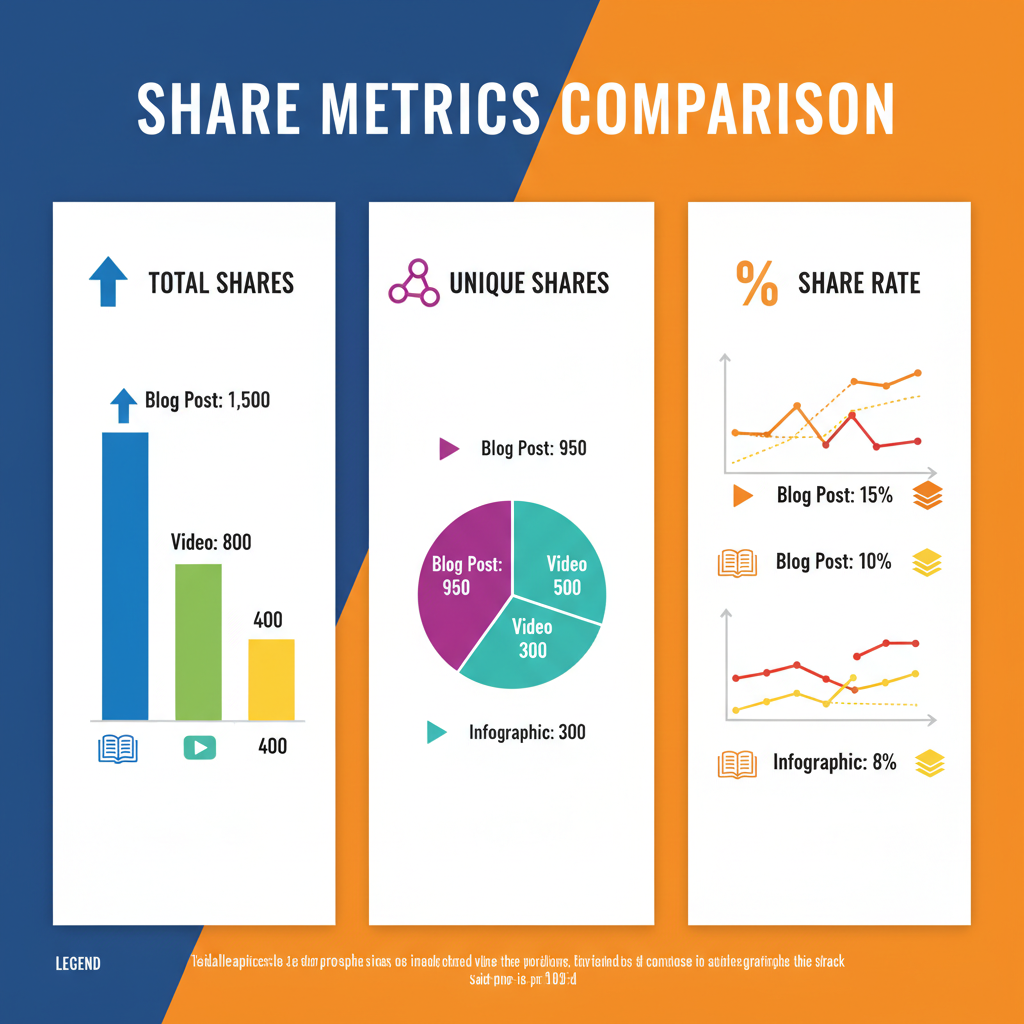
- Format: Determine whether videos, infographics, or text updates get shared more.
- Topics: Align content with subjects that generate higher shares (e.g., educational, inspirational, humorous).

---
Integrating Share Data with Other Analytics Tools
To gain a holistic view of your marketing performance, combine Facebook share analytics with other platforms:
- Google Analytics: Track referral traffic from shared posts to evaluate downstream actions like purchases or sign-ups.
- Social listening tools: Monitor brand mentions across platforms to understand the ripple effect of shares beyond Facebook.
- CRM software: Attribute leads or conversions to specific campaigns driven by high-sharing posts.
Integration enables you to connect engagement metrics with tangible business outcomes.
---
Case Study: Increasing Content Reach Through Share Analysis
Background: A lifestyle brand noticed their organic reach was plateauing.
Action steps:
- Reviewed Facebook share analytics to pinpoint the top-shared content over the last 90 days.
- Found that short, humorous video tutorials were shared 4x more than product photos.
- Increased production of such videos, adding relevant captions and calls-to-action.
- Scheduled them at peak sharing times identified from historical data.
Results:
- Organic reach increased by 45% in 2 months.
- Page followers grew by 20%.
- Website referral traffic from Facebook doubled.
This reinforces that focusing on share-worthy content can dramatically improve reach.
---
Best Practices for Encouraging More Shares Organically
Boosting your share counts isn’t luck — it’s strategy. Consider:
- Create emotional resonance — joy, surprise, or inspiration often leads to shares.
- Add strong calls-to-action — explicitly invite your audience to share the content.
- Optimize visuals — high-quality images and videos encourage re-sharing.
- Leverage trending topics — connect timely trends to your brand authentically.
- Engage back — thank people for sharing or tag them in follow-up posts.
---
Common Mistakes to Avoid When Analyzing Facebook Share Data
Avoid these pitfalls to maintain clarity and accuracy:
- Looking at shares in isolation — always compare with reach, clicks, and other metrics.
- Ignoring negative feedback — this hides potential reasons why content isn’t shared widely.
- Overgeneralizing from a small dataset — trends need consistent confirmation.
- Confusing correlation with causation — just because a post was shared more doesn’t mean one metric caused another without more evidence.
---
Conclusion: Action Plan for Using Facebook Share Analytics
Facebook share analytics offers invaluable insight into content virality, audience resonance, and brand reach. To act on this knowledge:
- Access your share data in Facebook Insights or Meta Business Suite.
- Interpret metrics together (shares, reach, engagement rate).
- Identify and replicate winning posts to scale organic reach.
- Understand your sharers through demographic and behavioral analysis.
- Track performance over time, refine your strategy, and integrate with other analytics.
By following these steps and avoiding common missteps, you can transform passive followers into active advocates who spread your message far beyond your immediate community.
Next step: Start tracking your shares today and experiment with changes to identify what sparks sharing in your audience. Over time, this data-driven approach will significantly increase your Facebook reach and engagement.