Complete FB Page Analysis Guide to Boost Engagement
Learn to run a comprehensive Facebook Page audit, analyze audience insights, track content performance, and apply strategies to boost engagement.

Complete FB Page Analysis Guide to Boost Engagement
An FB page analysis is a powerful method to measure, evaluate, and optimize your Facebook presence. By reviewing everything from your audience demographics to content performance and interaction rates, you gain actionable insights to increase visibility, grow followers, and drive consistent engagement. In this guide, you’ll learn how to conduct a thorough Facebook Page audit, interpret your findings, and apply strategies that steadily improve results.
---
Clarify Your FB Page Goals
Defining objectives is the first step in any FB page analysis. Without a clear target, data has little context.
Common goals include:
- Brand Awareness: Expand reach and visibility among target demographics.
- Lead Generation: Direct traffic to landing pages or collect subscriber information.
- Community Building: Create an active, loyal audience through content and conversation.
Tip: Write down SMART goals — Specific, Measurable, Achievable, Relevant, and Time-bound.
Example: Increase average post engagement rate from 5% to 8% within three months.
---
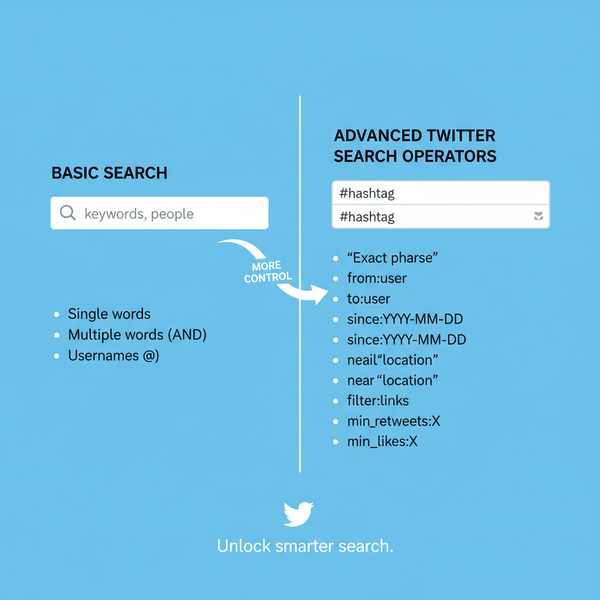
Identify Key Audience Demographics Using FB Insights
Facebook’s Page Insights offer valuable demographic data to inform your strategy.
Data Points to Review
- Age & Gender Distribution
- Top Countries & Cities
- Language Preferences
These metrics help you fine-tune your content tone, language, and posting schedule. For instance, a younger demographic might prefer short, dynamic videos, while older audiences tend toward thorough tutorials.

---
Review Post Performance Metrics
Your FB page analysis should assess core performance indicators for each post:
- Reach: Unique users who viewed the post.
- Engagement Rate (ER): Total engagements ÷ reach × 100.
- Click-Through Rate (CTR): Link clicks ÷ impressions × 100.
Formula for ER:
Engagement Rate (%) = (Total Interactions / Reach) × 100ER accounts for audience size, making it more insightful than just raw likes.
---
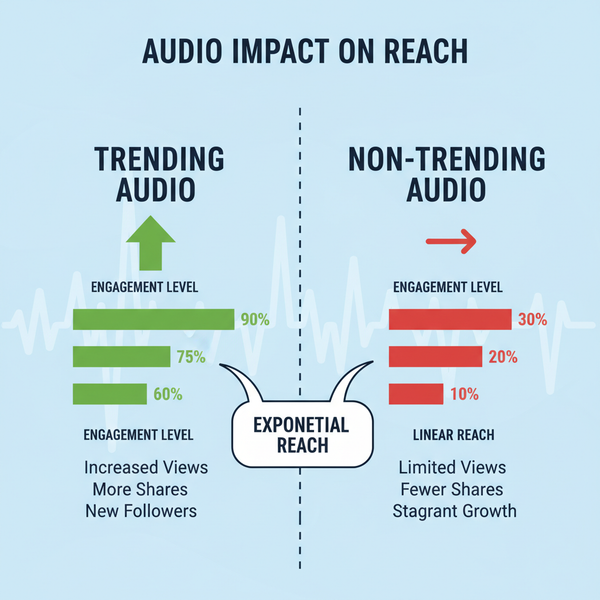
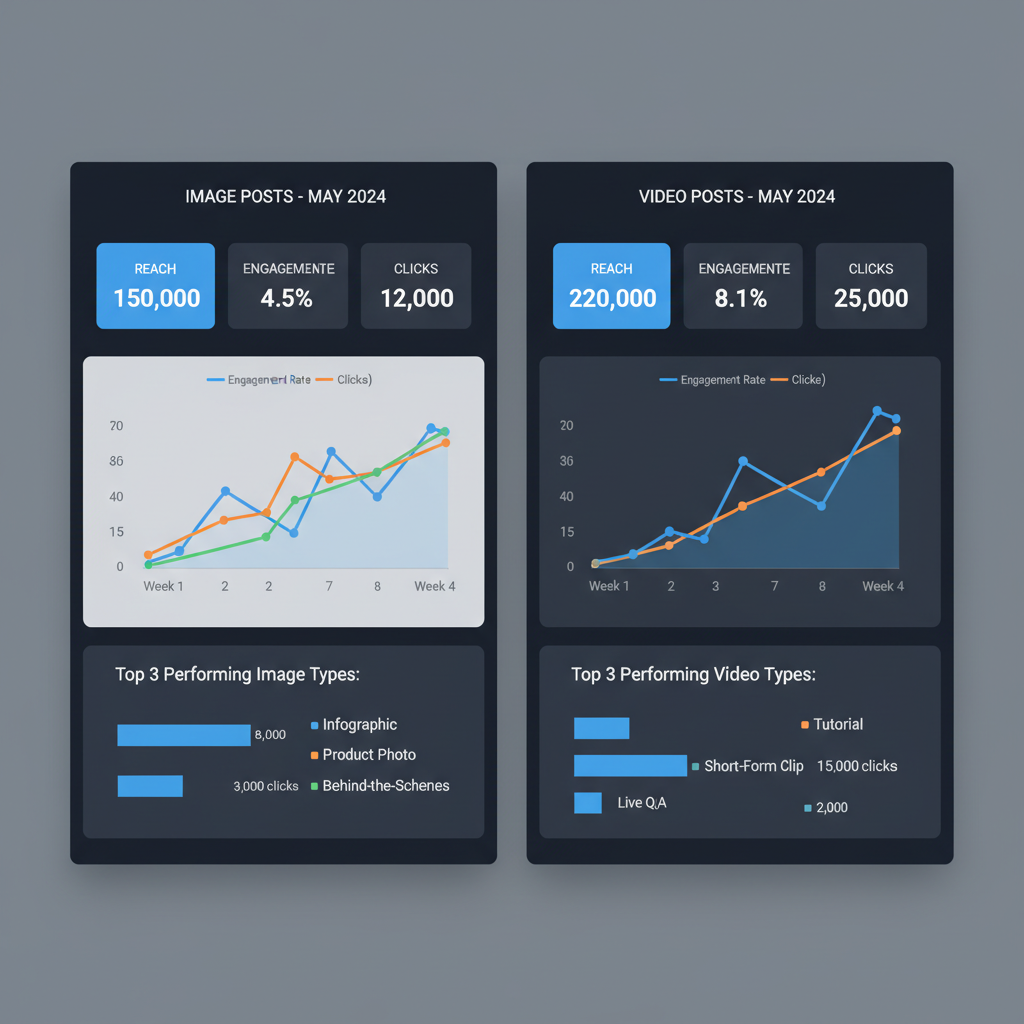
Analyze Content Types and Compare Performance
Compare how different content formats perform to refine your mix:
- Videos: Ideal for storytelling and product demos.
- Carousels: Showcase multiple features or items in one post.
- Link Posts: Send traffic directly to external resources.
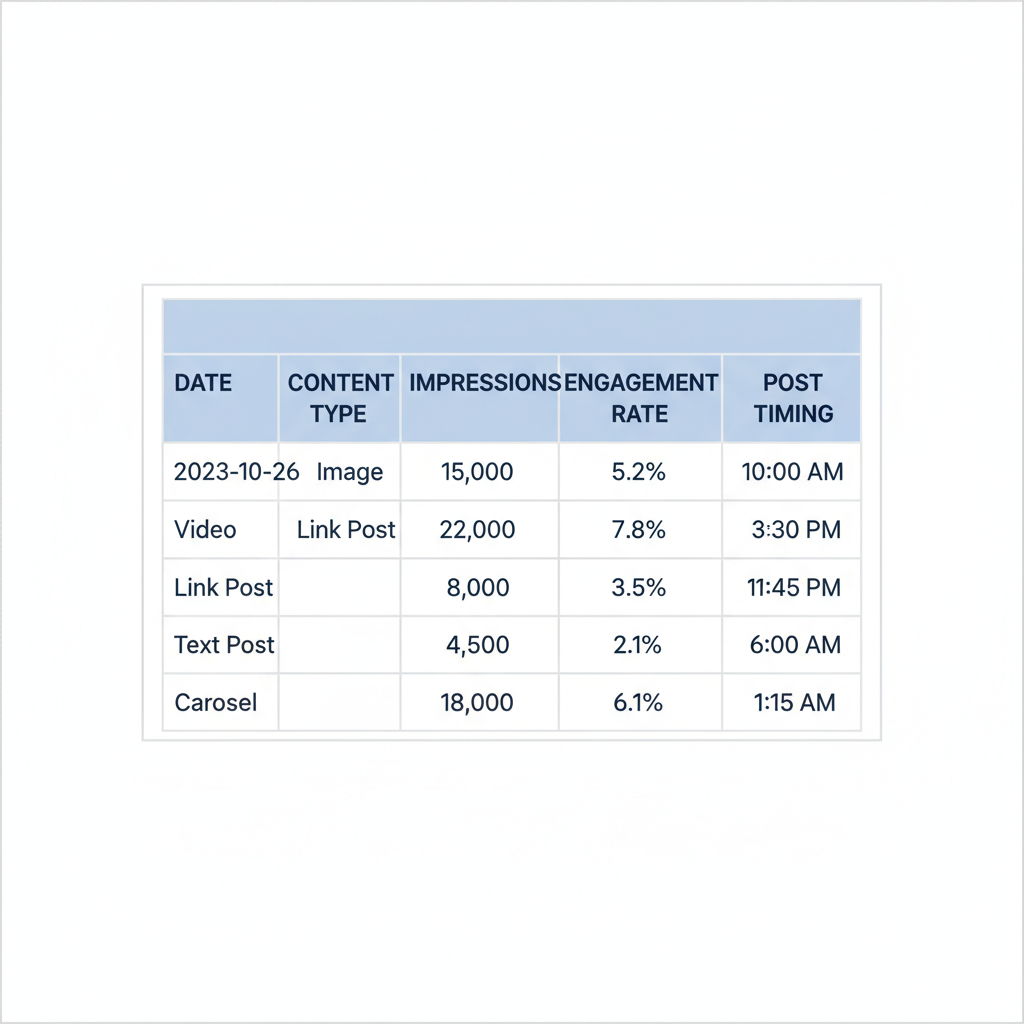
Example Performance Table
| Content Type | Average Reach | Average ER (%) | Average CTR (%) |
|---|---|---|---|
| Video | 5,200 | 7.5 | 2.1 |
| Carousel | 4,500 | 6.8 | 1.8 |
| Link Post | 3,900 | 5.2 | 3.4 |
If videos show strong ER and CTR, consider investing in more video production.
---
Check Posting Frequency and Timing
Timing and frequency directly influence engagement rates.
Use Insights to determine:
- Days of the week with highest engagement.
- Hours when your audience is most active.
Start with 3–5 posts a week, then refine based on your FB page analysis. Avoid over-posting to prevent user fatigue.
---
Evaluate Page Responsiveness
Facebook measures Response Rate and Response Time for private messages.
Ways to Improve:
- Set up automated responses during off-hours.
- Assign team members to manage comments and direct messages.
- Aim to reply within 24 hours to sustain trust.
---
Audit Visual Branding
Consistent visuals boost recall and professionalism.
Checklist:
- Cover Photo aligns with brand identity.
- Profile Image is clear and high resolution.
- Pinned Posts feature high-value content.
Match branding across all channels for cohesive identity.
---
Review Call-to-Action Button Setup
Strategically choose your FB Page’s CTA:
- Ensure it matches primary goals.
- Link it to a working landing page.
- Track click data via Facebook and Google Analytics.
Pro Tip: Test different CTA texts and placements to improve conversions.
---
Examine Follower Growth Trends and Spikes
Evaluate Likes and Followers for trends:
- Identify growth surges—determine triggers like campaigns or viral posts.
- Recognize declines—spot possible content gaps or audience disengagement.
This foresight allows for preemptive strategy adjustments.
---
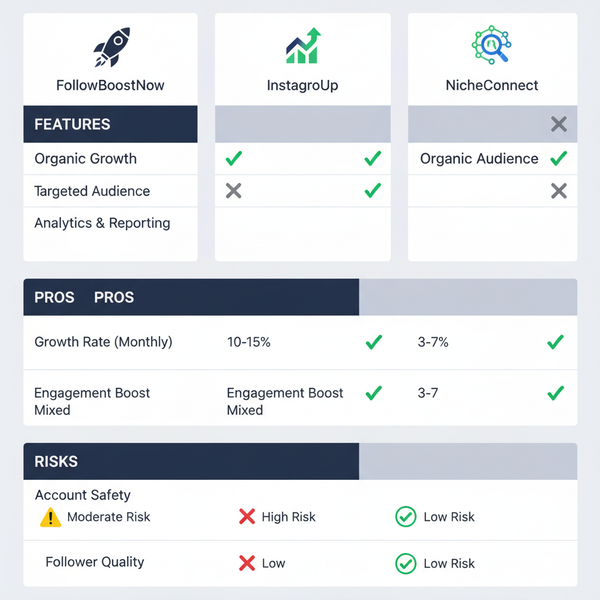
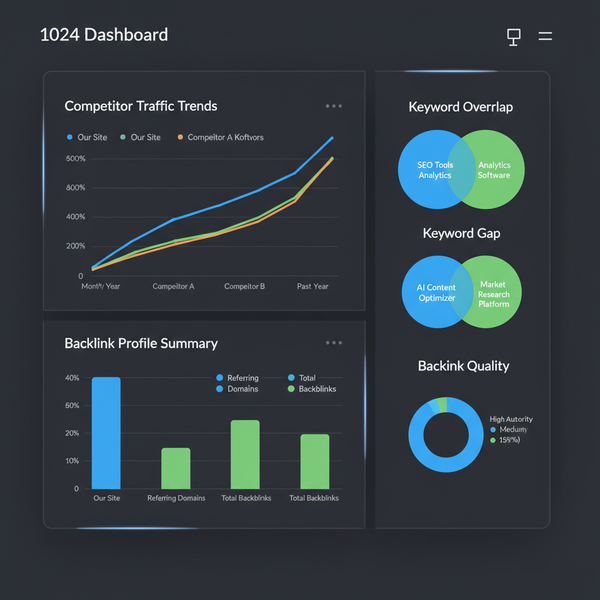
Monitor Competitor Pages
Competitive benchmarking sharpens your FB page analysis.
Look for:
- Their content types and formats.
- Average engagement rates.
- Posting frequency and communication style.
Use these insights to fill your own content gaps and outperform competitors.
---
Assess Ad Performance Linked to Your Page
Integrate Ad Insights in your evaluation:
- Compare reach and spend for efficiency.
- Review conversion rates to gauge ROI.
- Assess ad engagement—likes, shares, comments.
Combined organic and paid data provides a full picture of your FB activity impact.
---
Compile Findings Into an Actionable Report
Map your insights in a well-structured document:
- Add metric tables and screenshots.
- Interpret trends with clear reasoning.
- Organize into "Strengths," "Weaknesses," "Opportunities," and "Risks."
This organized view simplifies decision-making and progress tracking.
---
Set Improvement KPIs and Track Progress Monthly
Link KPIs to your goals:
- Raise monthly reach by 15%.
- Achieve a 10% engagement rate.
- Keep response time under 2 hours.
Update reports monthly to measure outcomes and refine tactics in real time.
---
Summary and Next Steps
A systematic FB page analysis isn’t just numbers—it’s a strategic habit that fuels growth. By defining goals, understanding your audience, optimizing content formats, and maintaining responsive communication, you transform your page into a high-engagement asset.
Start your first audit today, set monthly review reminders, and experiment with data-driven adjustments to see your Facebook presence thrive.
Ready to put these techniques into practice? Begin your FB page analysis now and watch your engagement climb.