Free Twitter Analytics: How to Track What Matters Without Paying
Track X (Twitter) performance free in 2025. Learn the metrics that matter, set up GA4 + UTM tracking, build a zero-cost workflow, and know when to upgrade.
Free Twitter Analytics: How to Track What Matters Without Paying

If you’re growing on X (formerly Twitter) in 2025, you can still track meaningful performance without buying a premium plan or expensive tools. The trick is focusing on the few metrics that tie to outcomes and building a lightweight, repeatable workflow that costs nothing but a bit of discipline.
What this guide covers
- What’s still visible for free on X, what’s paywalled, and realistic expectations
- Metrics that matter (and the vanity ones that don’t)
- Where to find native, free insights and how to capture them consistently
- GA4 + UTM tracking for traffic and conversions
- Free tools worth trying (pros, cons, and limits)
- A zero-cost analytics stack you can run weekly in under an hour
- How to run content experiments without paid tools
- Benchmarks and goals for smaller accounts
- When it’s time to graduate to paid analytics or API access
---
The state of free X analytics in 2025
X has tightened access to API and some analytics over the past few years, but you can still get enough signal to improve your content and attribute traffic.
What’s typically visible for free:
- Public post views on every post (impressions).
- Public counts for reposts, quotes, likes, bookmarks, and replies.
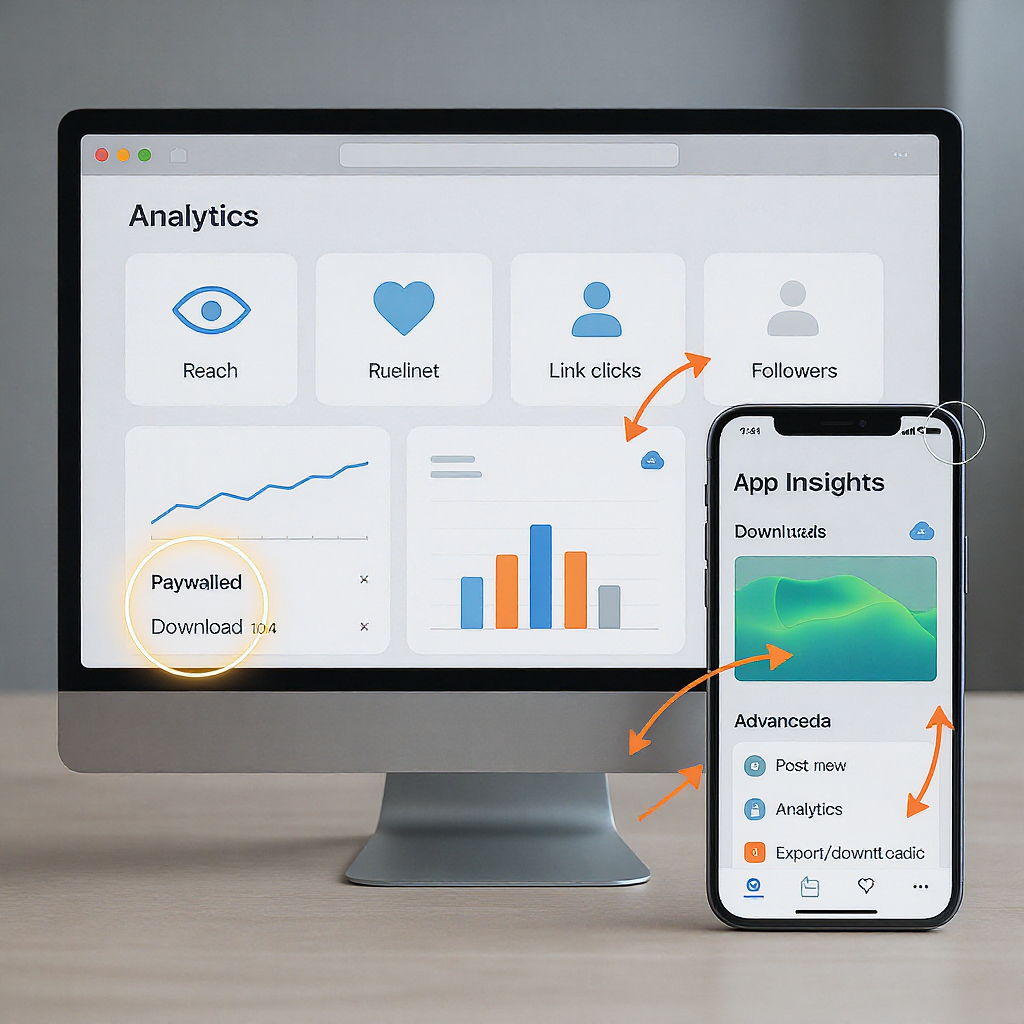
- For the author, a per-post analytics card (View post analytics) that often shows impressions and a breakdown of engagements such as link clicks, profile visits, follows from the post, detail expands, and more. Depth of detail may vary and can change over time.
- Basic notification feeds: who followed, who engaged, who clicked follow after seeing a post (inferred from timing).
Commonly paywalled or not consistently available for free:
- Account-level dashboards with historical rollups and exports.
- Audience demographics and advanced breakdowns.
- Bulk historical exports and automated data pulls.
- API access with meaningful rate limits.
Realistic expectations:
- You’ll rely on per-post screens and public counts, then log the numbers manually.
- “Good enough” attribution to traffic and conversions comes from GA4 + UTMs, not from X alone.
- Expect sampling noise and occasional inconsistencies. You’re aiming for directional trends, not audit-grade precision.
---
The metrics that actually matter
Focus on numbers that correlate with reach, brand demand, and business outcomes.
Priority metrics:
- Engagement rate: engagements ÷ impressions. Use the native “engagements” total if available; otherwise sum likes + replies + reposts + quotes + bookmarks + link clicks + profile visits (when shown).
- Link clicks: your clearest indicator of off-platform interest.
- Profile visits and follows per post: signals of brand demand; key for long-term growth.
- Impressions: necessary as the denominator and to gauge reach, but not a goal by itself.
Vanity metrics to downplay:
- Raw follower count without growth rate context.
- Single-post virality without sustained profile growth or clicks.
- Aggregate impressions across months without quality-of-audience context.
Rule of thumb: Prioritize engagement rate, follows per post, and link clicks over absolute likes or impressions.
---
Where to find native, free insights (and how to capture them)
On each post:
- Open the post you authored.
- Tap or click View post analytics.
- Capture:
- Impressions
- Engagements
- Link clicks (if shown)
- Profile visits (if shown)
- New follows (if shown)
- Reposts, quotes, likes, bookmarks, replies
From notifications:
- Track follows around the time key posts go live.
- Note high-signal interactions (e.g., verified accounts quote-tweeting you) that often drive secondary reach.
Simple ways to capture consistently:
- Create a weekly routine to list your last 7–14 days of posts.
- Use X search to enumerate posts:
from:yourhandle since:2025-09-01 until:2025-09-15Tip: For links, copy the exact URL you shared (with UTMs) so GA4 attribution stays consistent.
---
Track traffic and conversions for free with GA4 and UTMs
GA4 is your best source of truth for what X traffic actually does on your site.
Step-by-step setup:
- Install GA4
- Create a GA4 property in Google Analytics.
- Install the gtag or Google Tag Manager container on your site.
- Verify with GA4 Realtime that page_view events are firing.
- Mark conversions
- Identify your key actions (e.g., signup, trial start, purchase).
- In GA4 Admin > Events, mark them as conversions (toggle on).
- If needed, configure enhanced measurement or custom events.
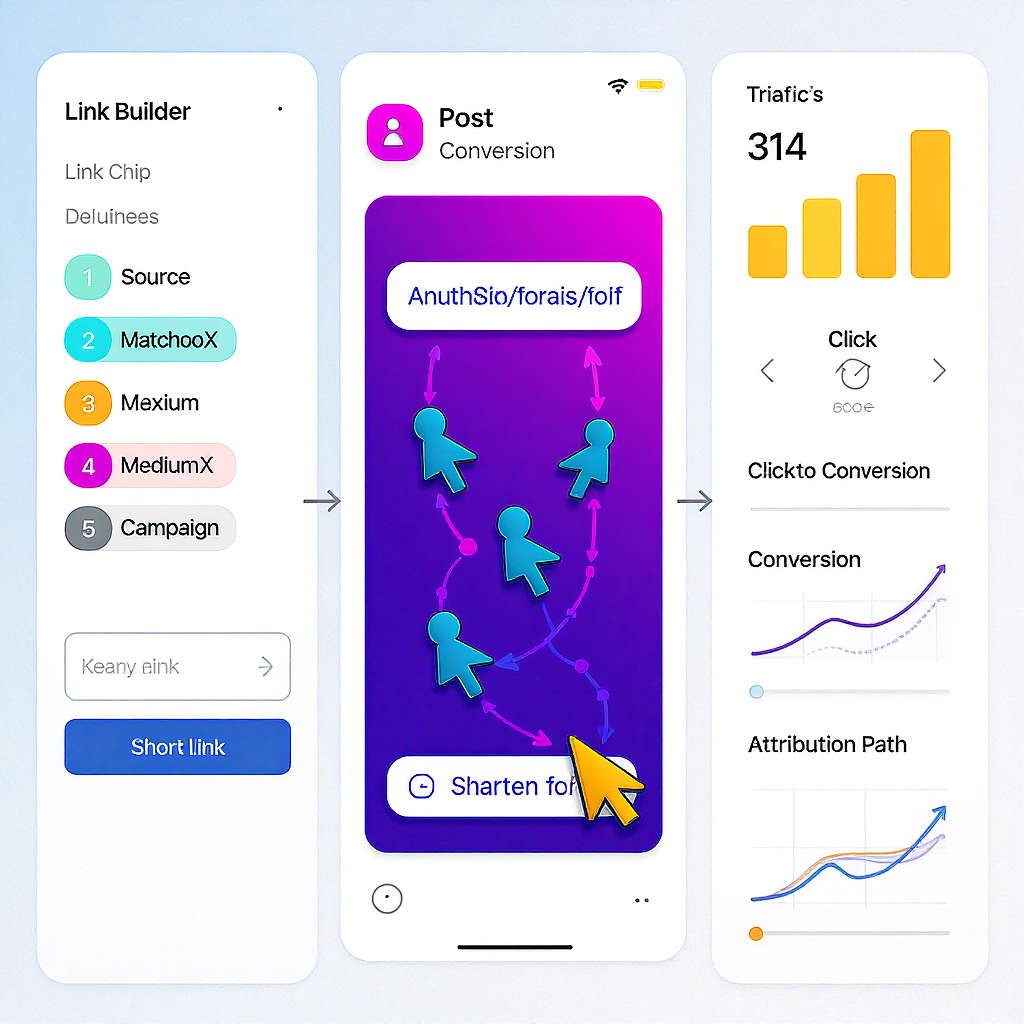
- Build UTM-tagged links
- Use consistent naming to keep reporting clean:
https://yourdomain.com/landing-page
  ?utm_source=x
  &utm_medium=social
  &utm_campaign=2025-q4-launch
&utm_content=thread-hook-a- Shorten (optional)
- Use Bitly (free) to shorten long URLs. UTMs pass through.
- Validate data flow
- Click your UTM link from mobile and desktop (consider an incognito window).
- In GA4 Realtime, confirm:
- Source/Medium shows x / social.
- The landing page is correct.
- The conversion event fires when you complete the action.
- Create a simple GA4 exploration
- Break down sessions or conversions by Session source/medium and Campaign.
- Save the exploration and check it weekly.
Naming conventions that scale:
- utm_source: x
- utm_medium: social
- utm_campaign: yyyy-qN-theme or product-launch-name
- utm_content: creative variant (thread-vs-single, image-vs-video, hook-a, hook-b)
---
Free tools worth trying (pros, cons, limits)
Availability can change; treat these as helpers, not single sources of truth.
| Tool | What it’s good for | Pros | Cons / Limits |
|---|---|---|---|
| Social Blade | Public follower trends | Historical charts, simple growth view | Limited granularity; no per-post analytics |
| Followerwonk | Follower analysis, bios, basic comparisons | Good for audience research | Free tier capped; some features require paid |
| Twitonomy | Post-level insights, mentions | Quick overviews | Stability varies; exports/paywalls common |
| Bitly | Link click counts | Passes UTMs; easy click logs | Limited breakdown on free tier |
| Buffer (free) | Scheduling + basic post insights | Light reporting; team-friendly | Analytics depth limited on free tier |
| Typefully (free) | Drafting threads; lightweight insights | Great writing UX | Deeper analytics require paid |
Use these alongside native post analytics and GA4 for a more complete picture.
---
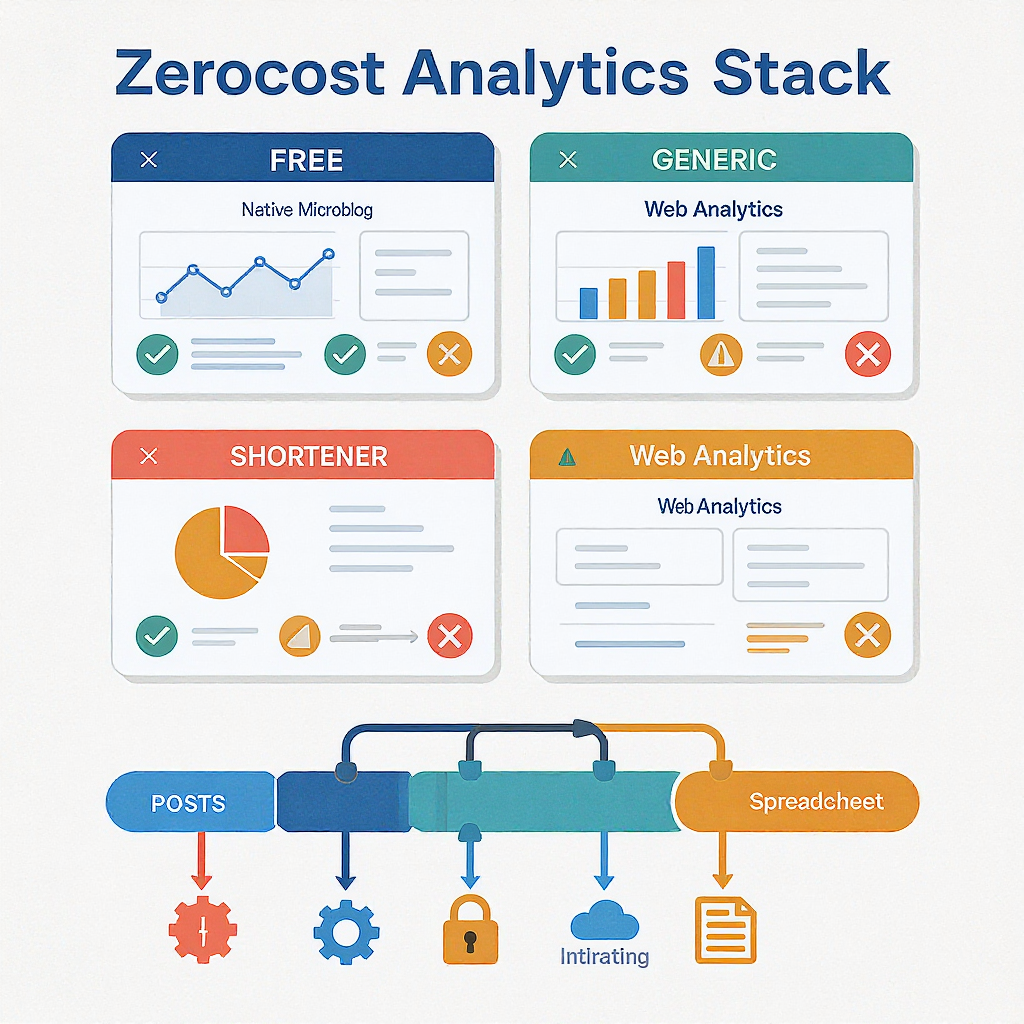
Build a zero-cost analytics stack
Components:
- Capture: X native post analytics + notifications
- Attribution: GA4 + UTMs (optional Bitly)
- Storage: A reusable spreadsheet (Google Sheets)
- Rhythm: Weekly data pull + monthly review
Spreadsheet template (columns):
- Date
- Post URL
- Post type (single, thread, video, image)
- Hook / topic
- Impressions
- Engagements
- Engagement rate
- Link clicks
- Profile visits
- Follows from post
- CTR (clicks ÷ impressions)
- Campaign (utm_campaign)
- Notes (context, collaborators)
Helpful formulas:
Engagement rate = =IFERROR(Engagements / Impressions, 0)
CTR = =IFERROR([Link Clicks] / Impressions, 0)
Follows per 1k impressions = =IFERROR([Follows] / Impressions * 1000, 0)
Weekly routine (45–60 minutes):
- List posts from the past 7 days with the X search query.
- Open each, record metrics from View post analytics.
- Paste Bitly click counts (if used).
- In GA4, record Sessions and Conversions for the campaign(s).
- Add 2–3 quick notes per top and bottom performer (what worked, what didn’t).
- Update a one-page summary:
- Top 3 posts by engagement rate
- Top 3 posts by link clicks
- Net followers gained
- Sessions and conversions attributed to X
Monthly cadence (30 minutes):
- Roll up to monthly totals and averages.
- Revisit content themes and formats; set 1–2 experiments for next month.
---
Run content experiments without paid tools
Design A/B-style tests you can execute with native and GA4 data.
What to test:
- Timing: morning vs. afternoon vs. evening (local audience time).
- Format: single post vs. thread; image vs. video vs. text-only.
- Hook: different first-line angles; question vs. bold statement.
- Hashtags: none vs. 1–2 relevant tags.
How to run:
- Hold as many variables constant as possible.
- Alternate variants across similar days/times for two weeks.
- Use per-post engagement rate and link clicks as primary outcomes.
- Use GA4 to compare sessions/conversions by utm_content.
Minimal experiment log:
- Experiment name, timeframe
- Hypothesis
- Variants and posting times
- Primary metric(s)
- Result and next decision (keep, kill, iterate)
---
Benchmarks and goals for smaller accounts
These are directional ranges; your niche, content quality, and posting frequency matter.
Engagement rate (engagements ÷ impressions):
- Under 1k followers: 2–5% is solid; >5% is excellent.
- 1k–10k followers: 1–3% is solid; >3% is strong.
- 10k–100k followers: 0.5–1.5% is common; >1.5% is strong.
Follows per post:
- 0.1–0.5% of impressions is a healthy target for small accounts.
- Threads and how-to posts tend to outperform news or pure commentary.
Click-through rate (CTR):
- 0.5–3% of impressions, depending on intent and the “ask.”
- Stronger when the link is tightly aligned to the post topic and value.
Growth pacing:
- New or rebooting accounts posting 3–5x/week can aim for 5–15% monthly follower growth in early months.
- As you scale, growth rates normalize; track net follows per week as your KPI.
Set goals you can control:
- Two experiments per month
- One “pillar” thread per week
- >1.5% engagement rate median within 90 days
- At least 20% of posts include a trackable link to owned content
---
When to graduate to paid analytics or API access
Signals you’ve outgrown free:
- You spend >2 hours/week on manual logging.
- You need multi-account rollups and historical exports for reporting.
- You require audience demographics, topic clustering, or influencer discovery.
- You must quantify revenue or pipeline sourced from X with precision.
- You’re running multi-variant experiments at scale and need automation.
Cost–benefit framing:
- Calculate your time cost: 2 hours/week at your hourly rate vs. a tool subscription.
- Estimate upside: If better insights can lift conversions by X%, what’s the monthly revenue gain?
- Consider data longevity: paid tools and API access provide durable history and export options.
Options to consider:
- Creator/analytics tools with robust exports and dashboards.
- API access tiers (costs vary and may start in the low hundreds USD/month) if you need programmatic pulls and custom pipelines.
- All-in-one social suites if you manage teams, approvals, and multiple channels.
Make the business case with a 90-day trial plan:
- Define 3–5 questions you can’t answer with free methods.
- Estimate time saved and expected impact on growth or revenue.
- Commit to a short-term pilot, then decide based on results.
---
Final checklist to win with free analytics
- Use native post analytics weekly; log consistently.
- Tag every outbound link with UTMs; validate in GA4.
- Track engagement rate, link clicks, profile visits, and follows per post.
- Run two small experiments per month; document learnings.
- Review monthly: double down on formats and hooks that convert.
- Only pay when the time-to-insight and decision quality justify the spend.
---
Summary
You can build a reliable, no-cost analytics workflow on X by combining native per-post insights with disciplined logging and GA4-based attribution. Focus on the few metrics that map to outcomes—engagement rate, link clicks, profile visits, and follows—and review them weekly and monthly to guide experiments. When manual effort outweighs insight, use your documented wins to justify a short, focused trial of paid tools or API access.