Create and Analyze a Graph of Instagram Followers Growth
Learn how to create, plot, and interpret Instagram follower growth graphs to uncover patterns, optimize strategies, and boost engagement.
Introduction to Instagram Follower Growth Graphs
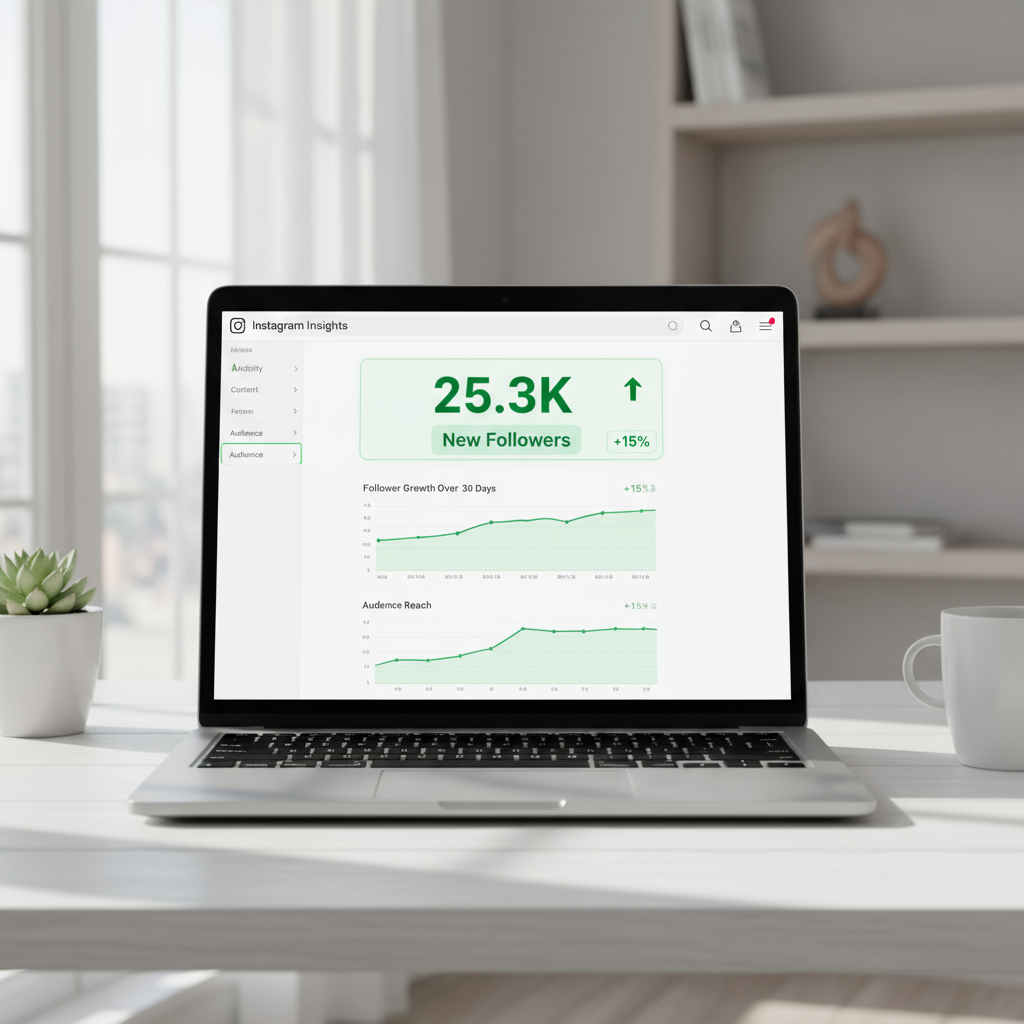
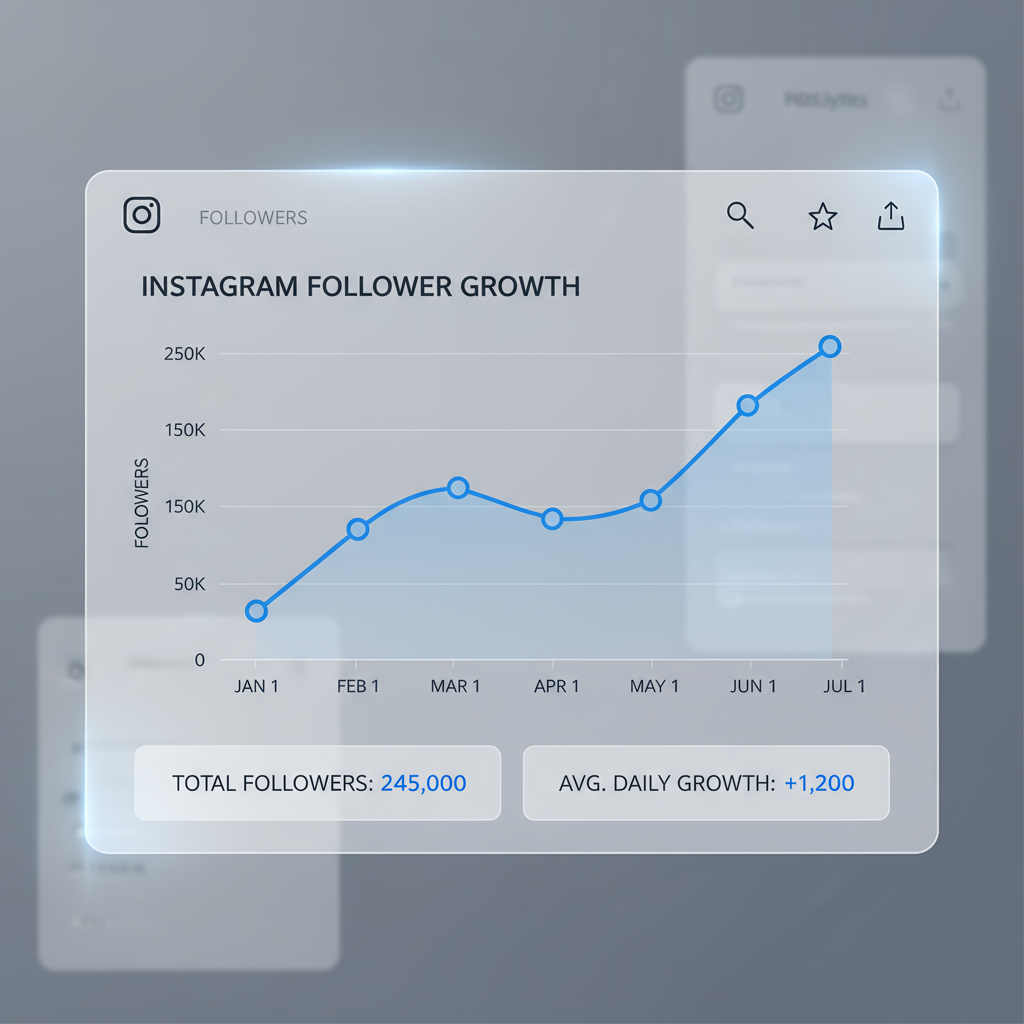
Tracking your Instagram follower growth through a well-designed graph provides a clear, visual way to measure your account’s progress over time. This graph of Instagram followers can turn raw numbers into actionable insights—helping you spot patterns, evaluate successful campaigns, and identify areas in need of improvement.
Counting followers alone misses the bigger picture. Trends, spikes, dips, and steady growth all reveal underlying stories about your content and strategy. Visualizing your data allows you to make informed marketing decisions rather than relying on assumptions.

By learning how to create, analyze, and interpret follower graphs, you can optimize posting schedules, refine marketing campaigns, and boost engagement for greater long-term results.
---
Choosing the Right Tools
Selecting the right tool is the first step toward building an accurate and useful graph of Instagram followers.
Native Instagram Insights
Instagram’s built-in Insights feature offers:
- Follower growth metrics: Changes over the past week.
- Demographics: Age, location, and gender breakdown.
- Engagement trends: Likes, comments, and shares.
Limitation: Native Insights provides limited historical data, preventing long-term trend analysis.
Third-Party Analytics Tools
Popular tools include:
- Hootsuite
- Later
- Sprout Social
- Iconosquare
These platforms offer broader tracking periods, automatic data exports, and custom graph creation capabilities that surpass native features.
---
Step-by-Step Guide to Exporting Follower Count Data
Before plotting your graph, it’s essential to gather accurate follower count data.
Using Instagram Insights
- Switch to a business or creator account in the Instagram app.
- Go to your profile and tap Insights.
- View the Audience section.
- Record daily or weekly follower counts manually.
Using Third-Party Tools
- Connect your Instagram account to the chosen analytics platform.
- Locate the Followers Growth or Analytics section.
- Export a CSV or Excel file containing historical data.
- Ensure the file includes date and follower count columns for accuracy.
---
Plotting Instagram Follower Growth
You can create your graph of Instagram followers with widely available software.
Excel
- Import your exported data.
- Select the date and follower count columns.
- Insert a line chart via Insert > Line Chart.
- Format axes and add a descriptive title.
Date       FollowerCount
2024-04-01  1500
2024-04-02  1523
2024-04-03  1550
Google Sheets
- Paste your data into a sheet.
- Select the relevant data range.
- Go to Insert > Chart, choose Line Chart.
- Customize labels and color schemes.
Data Visualization Apps
Platforms like Tableau, Power BI, or Google Data Studio enable deeper analysis, combining follower data with metrics like reach and engagement for richer insight.
---
Interpreting Trend Lines, Spikes, and Dips
The strength of a graph of Instagram followers lies in the ability to visually interpret patterns:
- Upward trend: Consistent growth due to active posting or popular content.
- Spikes: Sudden jumps often linked to collaborations, shoutouts, or viral posts.
- Dips: Losses triggered by controversial posts, reduced activity, or algorithm changes.
Example Interpretation
| Date Range | Trend | Possible Cause |
|---|---|---|
| April 1 - April 7 | +200 followers | Ran giveaway campaign |
| April 8 - April 14 | -50 followers | Reduced posting frequency |
---
Identifying Correlations Between Posts and Growth
Overlaying your posting history onto your follower graph helps identify cause-and-effect:
- Content Types: Compare videos vs. carousel posts.
- Posting Times: Adjust for optimal time zones.
- Special Campaigns: Measure the impact of promotions, collaborations, and contests.
Understanding these correlations helps refine your content strategy and eliminate formats that may hinder growth.
---
Planning Strategy with Follower Graphs
An accurate graph of Instagram followers enables informed strategic planning:
- Schedule posts during historically high-growth periods.
- Focus on content formats linked to spikes in followers.
- Adjust strategies during low-engagement periods.
Monthly reviews of follower graphs ensure that your strategy evolves with trends and audience behavior.
---
Setting Benchmarks and Growth Goals
Use historical data to set measurable goals:
- Monthly Growth Rate: Track average monthly increases.
- Campaign Growth Target: Aim for boosts during special events.
Example Goal Setting
| Metric | Current Average | Goal |
|---|---|---|
| Monthly Growth | 5% | 7% |
| Peak Growth Weeks | 2 per quarter | 3 per quarter |
---
Avoiding Common Mistakes
Steer clear of these pitfalls when analyzing follower graphs:
- Short datasets: A week of data is insufficient to reveal trends.
- Ignoring engagement: Follower counts must be paired with interaction metrics.
- Wrong assumptions: Correlation doesn’t equal causation.
- Overlooking seasonality: Account for holiday or event-driven fluctuations.
---
Advanced Tips: Segmenting Follower Data
Gain deeper insights with segmentation:
- Demographics Analysis: Age, gender, location breakdowns.
- Engagement-Based Segmentation: Differentiate active vs. passive followers.
- Source Attribution: Identify followers from ads, hashtags, or organic reach.
Segmentation allows you to tailor content more precisely and improve targeting efficiency.
---
Conclusion: From Graphs to Growth
Creating and analyzing a graph of Instagram followers is a strategic process that transforms raw data into actionable growth plans. By gathering accurate data, visualizing trends, linking actions to outcomes, and setting measurable objectives, you can maximize engagement and build a stronger, more loyal audience.
Your follower graph becomes a roadmap—not just for tracking growth, but for actively designing it. Start plotting today, and turn your insights into a well-structured Instagram growth strategy.
Ready to make your Instagram growth measurable? Begin tracking, graphing, and analyzing to take control of your audience and content strategy.