Facebook Insights 分析技巧提升互動率
Learn how to analyze Facebook Insights data, interpret demographics, and optimize post performance to boost engagement and grow your audience.
Understanding the Basics of Facebook Insights Dashboard
Facebook Insights is a powerful analytics tool that enables page admins to track performance, understand audience behavior, and optimize social media strategies. Whether you manage a brand page or a personal blog with a large following, mastering Facebook Insights analysis can significantly improve your interaction rates, audience growth, and business outcomes.
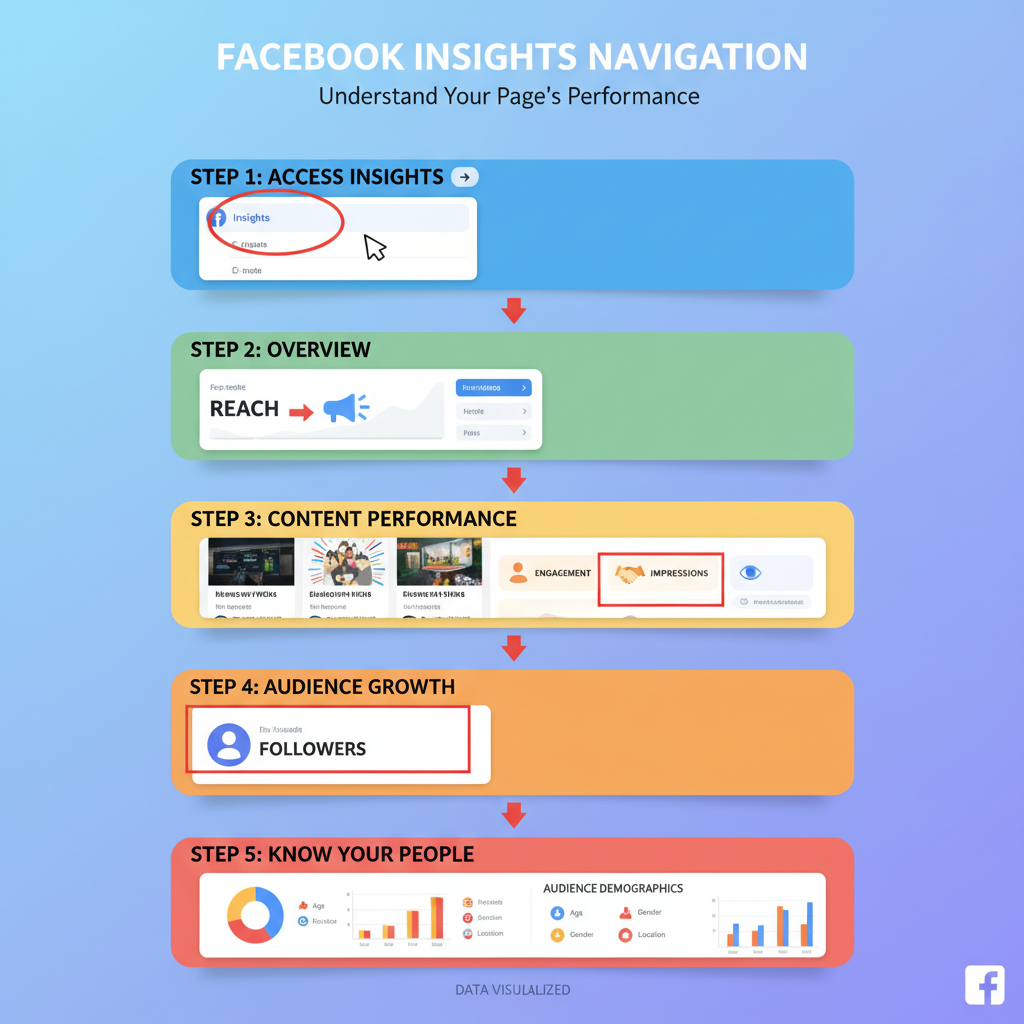
Once you have access to your Facebook Page, you can navigate to Insights from the left-hand menu. The dashboard offers a high-level overview of your page’s health and performance, using visual graphs and tables to summarize core metrics.

Key benefits of using Facebook Insights include:
- Measuring engagement to see how audiences interact with your content.
- Identifying content trends for better future planning.
- Understanding audience demographics for targeted campaigns.
- Tracking performance over time to detect growth or decline patterns.
---
Navigating Key Metrics: Reach, Engagement, Impressions, and Followers
In the Facebook Insights dashboard, four core metrics stand out for daily monitoring:
- Reach
- The total number of unique users who have seen your post.
- Engagement
- Includes likes, comments, shares, and link clicks.
- Impressions
- The number of times your content appears on-screen (including repeat views from the same user).
- Followers
- The number of people who have chosen to follow your page.
These indicators show how well your content is being distributed and whether it resonates with your audience. Monitoring fluctuations in these metrics can guide decisions on what to post, when to post, and how to allocate promotion resources.
---
Interpreting Audience Demographics for Targeted Content Creation
Knowing your audience demographics allows for tailored messaging that maximizes relevance. Facebook Insights provides detailed data such as:
- Age and gender distribution
- Geographic location
- Language preferences
- Device usage
Analyzing these demographics helps align content with audience characteristics. For example, if your page predominantly reaches an audience aged 18–24 in urban areas, producing trendy, fast-paced videos with city backdrops may enhance engagement.
Tip: Use cultural and linguistic relevance to boost relatability, shareability, and click-through rates.
---
Analyzing Post Performance: Content Type, Timing, and Format Trends
Every post performs differently depending on content type (image, video, link), posting time, and format specifics.
Steps to Analyze Post Performance
- Navigate to Posts in Facebook Insights.
- Review the Post Types data to assess engagement per format.
- Compare posting times with engagement metrics.
| Content Type | Average Reach | Average Engagement Rate |
|---|---|---|
| Image Post | 4,500 | 6% |
| Video Post | 6,200 | 9% |
| Link Post | 3,800 | 4% |
By identifying patterns, you can prioritize formats that deliver the highest returns. If videos consistently outperform others, increase video content production to leverage this strength.
---
Tracking Page Views and Actions on Page for Conversion Optimization
Page Views measure how many times visitors access your page, while Actions on Page reflect interactive behaviors such as:
- Clicks on contact information
- Use of call-to-action buttons
- Link clicks to your website
High page views with low actions suggest audience interest without commitment — a prime opportunity to optimize CTAs, rearrange page elements, and refine messaging to better convert visitors into leads or customers.
---
Using Video Insights to Improve Retention and Watch Time
Video content can generate higher engagement than static posts. Within Facebook Insights, Video Metrics include:
- 3-second views
- 10-second views
- Average watch time
- Audience retention graphs
By tracking watch time patterns, you can spot drop-off points and adjust content accordingly. Strategies may include shortening videos, creating more compelling opening visuals, or adding captions to appeal to silent viewers.
---
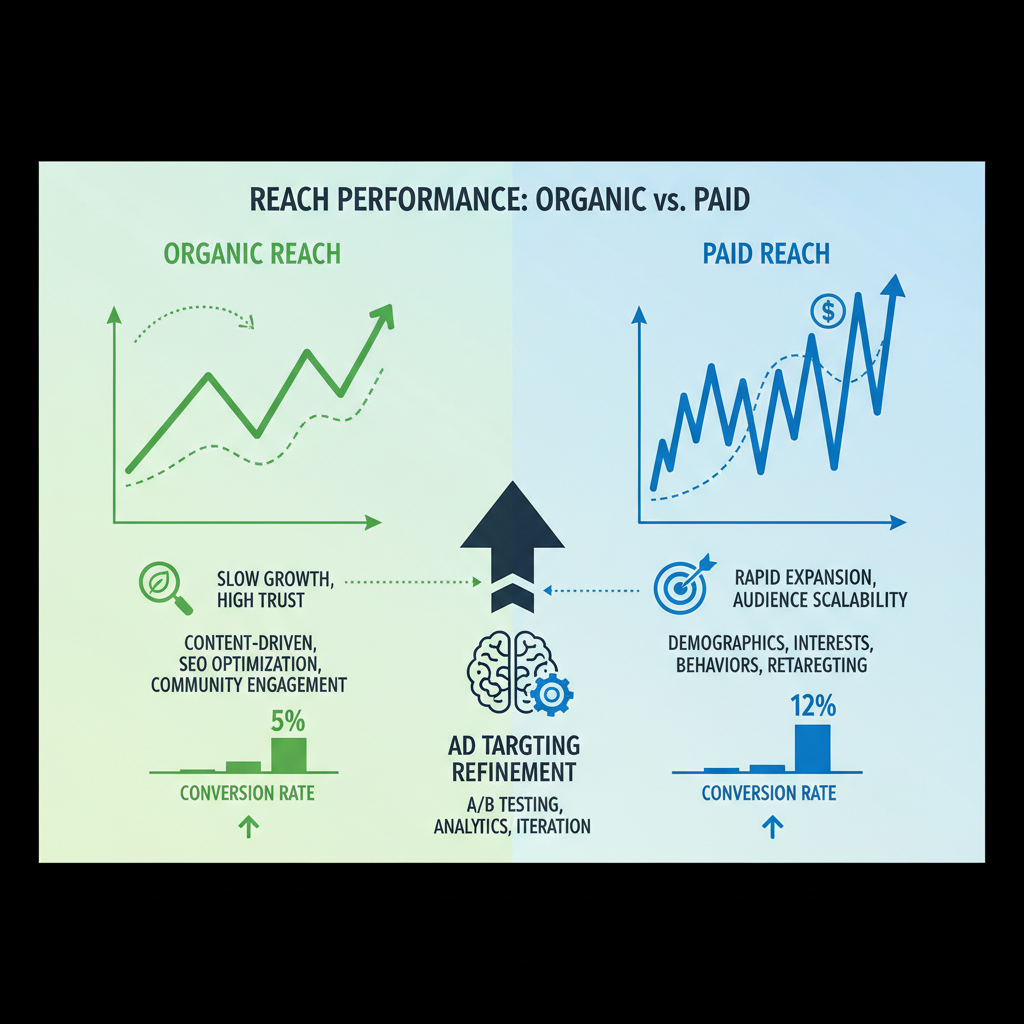
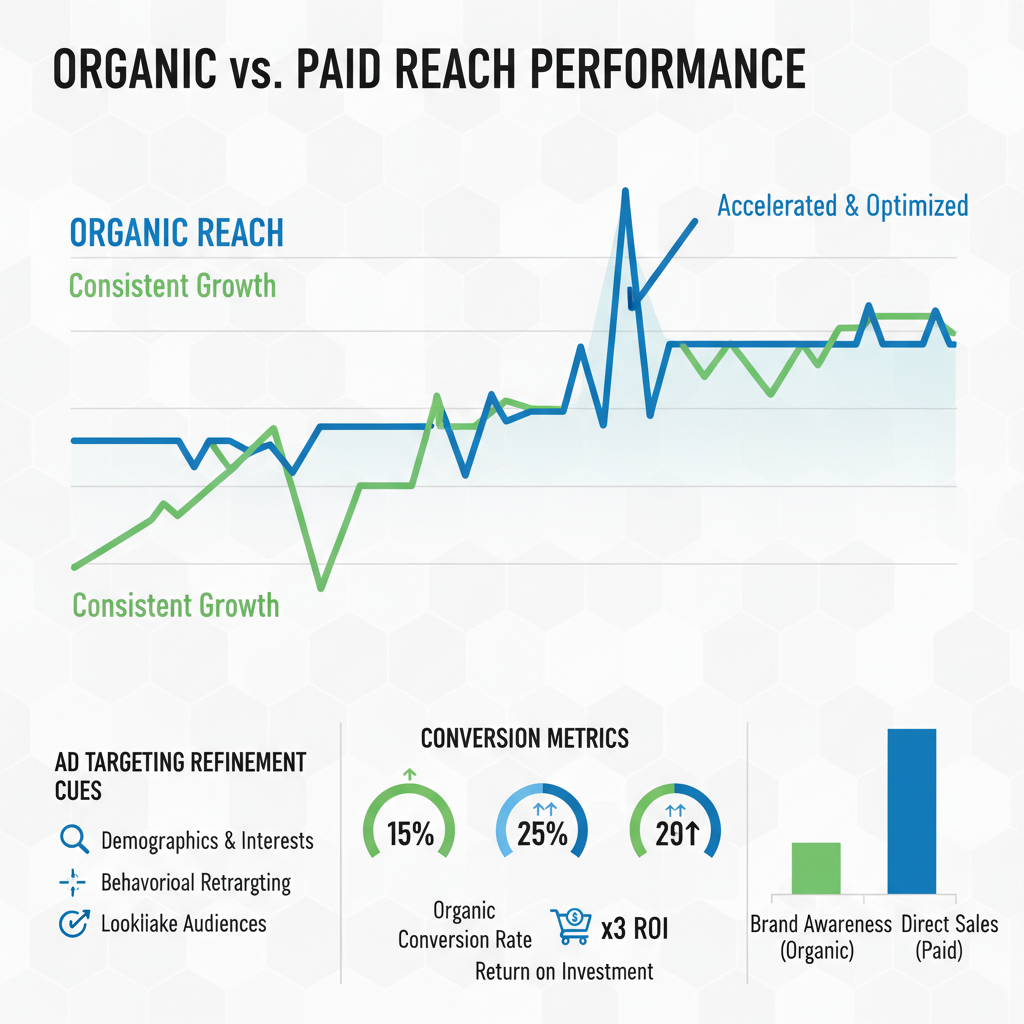
Comparing Organic vs Paid Reach and Refining Ad Targeting
Facebook differentiates between Organic Reach (free distribution) and Paid Reach (ad-supported distribution).
Evaluating these metrics allows you to:
- Determine if paid campaigns expand your audience or saturate existing followers.
- Refine ad targeting parameters to reach new segments.
- Allocate ad budgets to posts with proven strong organic engagement.
- Avoid wasting spend on underperforming creatives.
---
Monitoring Top-Performing Posts to Replicate Success Patterns
The Insights dashboard enables sorting posts by engagement, reach, or interaction type. When analyzing top posts, capture factors such as:
- Topic relevance
- Tone and style
- Visual composition
- Posting day/time
Replicate successful patterns while experimenting with variations to maintain and build on high engagement levels.
---
Identifying Declining Metrics and Applying Corrective Strategies
A consistent metric decline warrants structured review:
- Define the time period of decline.
- Investigate potential causes (algorithm changes, content relevance, posting frequency).
- Implement remedies — e.g., adjust tone, increase posting cadence, refresh visuals.
Use A/B testing to validate which changes lead to measurable improvement.
---
Exporting and Scheduling Regular Insights Reports for Ongoing Analysis
Facebook Insights allows exporting data in CSV or Excel formats. This facilitates archiving and performance benchmarking.
Steps:
- Click Export Data in Insights.
- Select desired metrics and date range.
- Choose file format.
Scheduling weekly or monthly exports helps maintain continuous tracking and spot early trends, enabling proactive strategic adjustments.
---
Integrating Facebook Insights Data with Other Analytics Tools
Merge Facebook Insights findings with other analytics platforms such as Google Analytics, CRM dashboards, or marketing automation suites for a comprehensive view of behavior across channels.
Examples:
- Apply UTM parameters to Facebook links for precise Google Analytics tracking.
- Align demographic data with CRM segments for personalized outreach.
---
Creating a Monthly Optimization Plan Based on Insights Findings
A monthly optimization plan fosters continuous growth. Core actions may include:
- Review Key Metrics: Reach, Engagement, Impressions, Followers.
- Identify Best Content Types/Formats: Focus on consistently high-performing formats.
- Adjust Posting Schedule: Match audience activity patterns.
- Monitor Conversions: Improve CTAs and on-page interactions.
- Set Paid Campaign Goals: Based on organic performance benchmarks.
- Test New Strategies: Make incremental metric-driven changes.
---
Conclusion
Mastering facebook insights 分析 empowers marketers and page admins to boost engagement, grow audiences, and drive conversions. From exploring the dashboard’s basics to integrating data with other analytics tools, each tactic outlined here enhances your ability to refine strategies for optimal outcomes.
By adopting a data-driven approach and committing to regular analysis, you can transform casual followers into an engaged community, while improving ROI on Facebook campaigns. Begin applying these best practices today to see measurable growth in your social media performance.