Build a Media Dashboard to Track Performance Metrics
Learn how to build a media dashboard to track KPIs across social, PR, and advertising, integrating data sources for informed decision-making.
Build a Media Dashboard to Track Performance Metrics
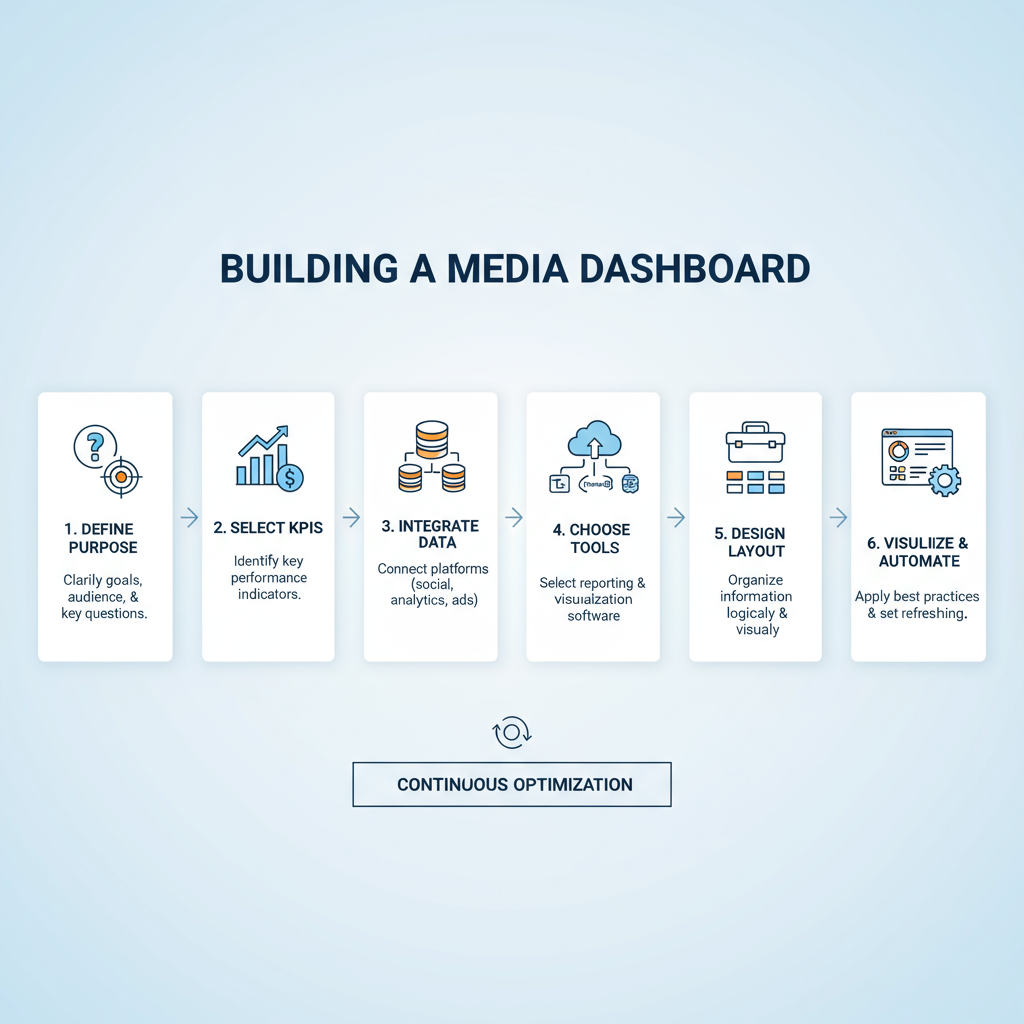
A media dashboard is a powerful tool that helps marketing, PR, and advertising teams track, analyze, and optimize performance metrics across multiple channels. By consolidating social media analytics, PR coverage, and advertising KPIs into one centralized hub, teams can quickly identify trends, measure impact, and make informed, data-driven decisions. This guide walks you through the process of building a media dashboard—from defining goals to ensuring security—so you can improve efficiency, collaboration, and ROI.

---
Define the Purpose of Your Media Dashboard
Before diving into dashboard design, clarify its objectives:
- Will it track social media KPIs like engagement, reach, and follower growth?
- Will it highlight public relations achievements such as media mentions and sentiment analysis?
- Will it measure advertising performance metrics like click-through rates (CTR), impressions, conversions, and return on ad spend (ROAS)?
Establishing a clear purpose ensures you choose the right data sources, KPIs, and layout to match your team’s strategic goals.
---
Choose Relevant KPIs and Metrics
Your media dashboard should focus on metrics that influence decisions—not vanity metrics. Commonly used KPIs include:
- Engagement Rate – Interactions divided by total impressions or followers.
- Reach – Number of unique users who viewed the content.
- Click-Through Rate (CTR) – Percentage of impressions that resulted in clicks.
- Conversions – Number of users completing desired actions (purchase, signup, download).
- Share of Voice (SOV) – Brand mentions compared to competitors.
Here’s an at-a-glance overview:
| KPI | Definition | Primary Channel |
|---|---|---|
| Engagement Rate | % of audience interacting with content | Social Media |
| Reach | Number of unique viewers | Social Media, PR |
| CTR | % of impressions that resulted in clicks | Advertising |
| Conversions | Number of completed desired actions | Advertising, Website |
| SOV | Brand visibility compared to competitors | PR, Social |
---
Select the Right Data Sources and Integrate Them
Identify where your data resides:
- Social Media Platforms – Facebook, X/Twitter, Instagram, LinkedIn.
- Ad Managers – Google Ads, Meta Ads Manager, LinkedIn Campaign Manager.
- Analytics Tools – Google Analytics, Adobe Analytics, PR monitoring platforms.
- Third-party APIs – Custom integrations for niche data.
Integration options:
- Native connectors from your dashboard platform.
- API calls for automated data pulls.
- CSV/XLS imports for periodically refreshed offline data.
---
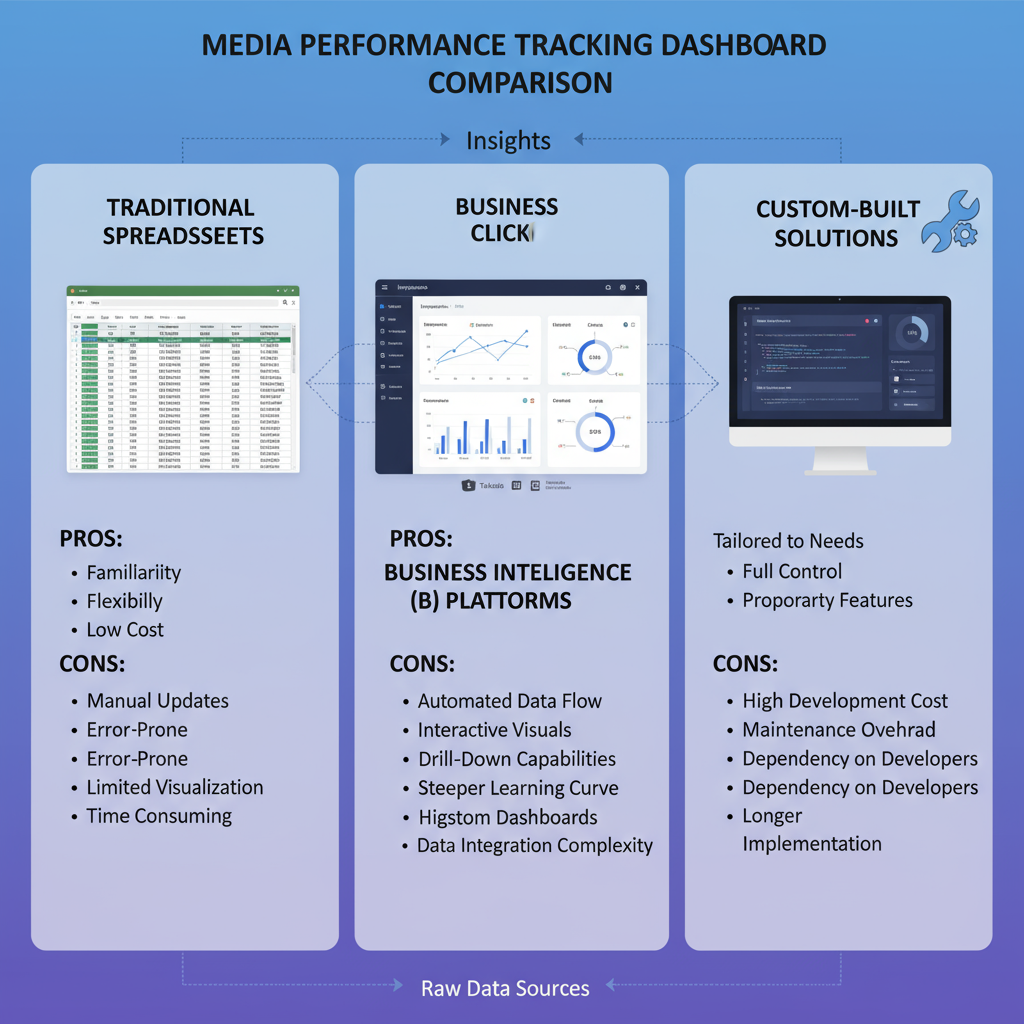
Decide on Dashboard Format and Tools
Select tools suited to your objectives and team skills:
- Google Data Studio (Looker Studio) – User-friendly, integrates with Google products.
- Tableau – Enterprise-ready, robust visualizations, high scalability.
- Power BI – Strong Microsoft ecosystem integration.
Key factors:
- Team’s technical proficiency.
- Depth of customization needed.
- Budget and licensing costs.
---
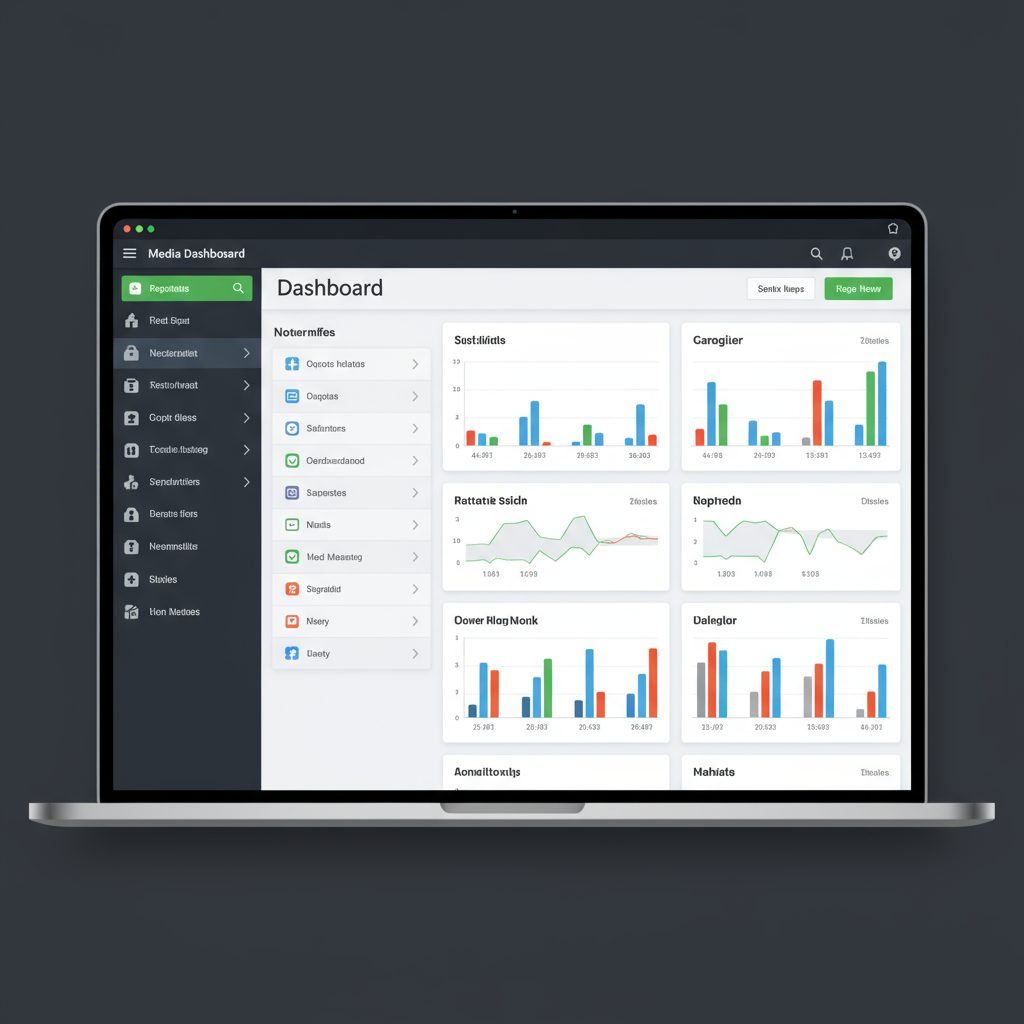
Design a User-Friendly Layout
A clear, intuitive layout encourages adoption:
- Header Area – High-level KPIs.
- Middle Panels – Trends, charts by channel.
- Bottom Section – Detailed tables for deep analysis.
Best practices:
- Group related charts and KPIs.
- Avoid clutter; keep the default view streamlined.
- Separate sections for social media, PR, and advertising.
---
Apply Visualization Best Practices
Effective visuals improve comprehension:
- Use bar/column charts for comparing values.
- Use line charts for showing trends over time.
- Apply color coding for channels, sentiment, or traffic sources.
- Keep color palettes simple for readability.
Example:
Reach
|████████████| Facebook
|-------|---------|
|█████       | LinkedIn
---
Set Up Automated Data Updates and Error Checks
Automate updates to ensure timeliness:
- Scheduled Refreshes – Daily or hourly.
- Error Alerts – Trigger notifications if data fails to load.
- Data Validation – Detect and flag anomalies.
Automation minimizes manual intervention and enhances reliability.
---
Incorporate Filters and Date Range Selectors
Filters add versatility for multiple stakeholders:
- Date Pickers – Compare time periods.
- Channel Filters – Toggle between PR, social, advertising data.
- Region Filters – Analyze geotargeted campaign performance.
---
Create Role-Based Views
Customize views to fit user needs:
- Analysts – Detailed, granular campaign data with cost metrics.
- PR Teams – Media coverage, sentiment trends, Share of Voice.
- Executives – Top-line summaries with ROI indicators.
Role-based permissions streamline views and protect sensitive information.
---
Test with Real Scenarios and Gather Feedback
Validate your dashboard’s accuracy and usability:
- Compare displayed data to verified reports.
- Run simulated campaign scenarios.
- Gather feedback from all user roles.
This process ensures your media dashboard delivers actionable and trustable insights.
---
Iterate Design Based on Feedback
Upon review:
- Fix navigation or visibility issues.
- Adjust visual hierarchy for key metrics.
- Incorporate missing data streams.
Continuous improvement keeps the dashboard aligned with evolving needs.
---
Establish a Maintenance Schedule
Keep data and dashboards fresh:
- Monthly Checks – Verify all data connections.
- Quarterly KPI Review – Adjust metrics to current strategies.
- Annual Overhaul – Update design, remove outdated elements.
Ongoing updates help sustain accuracy and relevance.
---
Ensure Data Security and Compliance
Protect sensitive information:
- Access Controls – Limit viewing rights.
- Secure Connections – Use encryption for data transfers.
- Regulatory Compliance – Follow GDPR, CCPA, and regional laws.
Security is fundamental to user trust.
---
Document Workflows and Train Your Team
Create comprehensive documentation:
- Data setup instructions.
- Clear KPI definitions.
- Troubleshooting processes.
Train all users to independently navigate and interpret dashboard data.
---
Final Thoughts
A thoughtfully built media dashboard unites data from varied channels into a single, strategic view—empowering teams to make quicker, smarter decisions. By defining clear goals, focusing on relevant KPIs, integrating reliable data sources, applying visual best practices, and maintaining security, your dashboard can become a vital tool for optimizing media performance.
Ready to boost your media tracking? Start building a scalable media dashboard today and give your team the insights they need to succeed.
![Why Luck Matters More Than Talent for Success in Life | [Jingwei Insight]](/content/images/size/w600/2025/10/img_001-103.jpg)