How to Calculate Engagement Rate: Formulas, Examples, and Channel-Specific Benchmarks
Learn how to calculate engagement rate by followers, reach, and impressions, with formulas, examples, channel-specific benchmarks, and tips to improve ER.

How to Calculate Engagement Rate: Formulas, Examples, and Channel-Specific Benchmarks

Understanding engagement rate helps you measure how compelling your content is for the people who actually encounter it. This guide clarifies what counts as an engagement, how to choose the right denominator, and how to compute ER at post, account, and campaign levels. You’ll also find channel-specific tips, benchmarks, and a practical workflow to improve ER over time.
If you’re trying to understand how to calculate engagement rate, you’re really asking: “How much does my audience care enough to interact?” Engagement rate (ER) is a quality signal for attention, consideration, and community health. It complements reach and impressions by showing what people did, not just what they saw.
- Awareness: ER helps differentiate passive exposure from meaningful interaction.
- Consideration: Clicks, saves, and longer watch times signal intent and content-market fit.
- Community health: Comments, replies, DMs, and shares show two-way relationships and advocacy.
High engagement on relevant actions typically correlates with stronger recall, downstream conversions, and lower media costs over time.
What Counts as an Engagement?
“Engagement” isn’t one-size-fits-all. It varies by platform and objective. Common actions include:
- Reactions: Likes, reactions (e.g., Love, Haha), upvotes
- Comments and replies
- Shares, reposts, retweets, quotes
- Saves/favorites/bookmarks
- Link clicks and CTA button taps
- Profile taps/visits, follows/subscribes gained
- Video views, rewatches, average percentage viewed, completions
- Story interactions: replies, sticker taps (poll, quiz, emoji slider), link clicks, next/back taps
When to Include or Exclude
- Include actions aligned to your goal. If the goal is traffic, include link clicks; if it’s community building, weight comments and replies more heavily.
- Video views are tricky. Many platforms auto-count short plays; consider minimum play thresholds or use completions/retention as a companion metric.
- Beware double-counting. Some exports break out clicks by type; avoid summing totals and sub-totals together.
Tip: Maintain a documented definition per channel and per reporting context (organic vs paid, post vs campaign).
Core Engagement Rate Formulas (Pros and Cons)
There are three common denominators. Each answers a slightly different question.
- ER by Followers (ERf) = Total engagements ÷ Followers
- Pros: Simple, stable over time; useful for creator comparisons.
- Cons: Penalizes fast-growing accounts; excludes non-follower reach (especially via recommendations and shares).
- ER by Reach (ERr) = Total engagements ÷ Reach (unique people reached)
- Pros: Measures interaction among those actually exposed; good for organic content and paid reach buys.
- Cons: Requires reliable unique reach; deduplication across posts can be difficult.
- ER by Impressions (ERi) = Total engagements ÷ Impressions (total views)
- Pros: Most stable denominator in feed-based environments; robust for paid and high-frequency placements.
- Cons: Can understate performance when frequency is high; not a “unique people” measure.
Post-, Account-, and Campaign-Level
- Post-level: Use the post’s reach or impressions for the denominator.
- Account-level (e.g., 30 days): Sum engagements; use unique reach (preferred). If you can’t dedupe reach, use impressions or followers with caution.
- Campaign-level: Sum engagements across posts/ads; use deduped reach if your platform/ad manager provides it, otherwise use impressions.

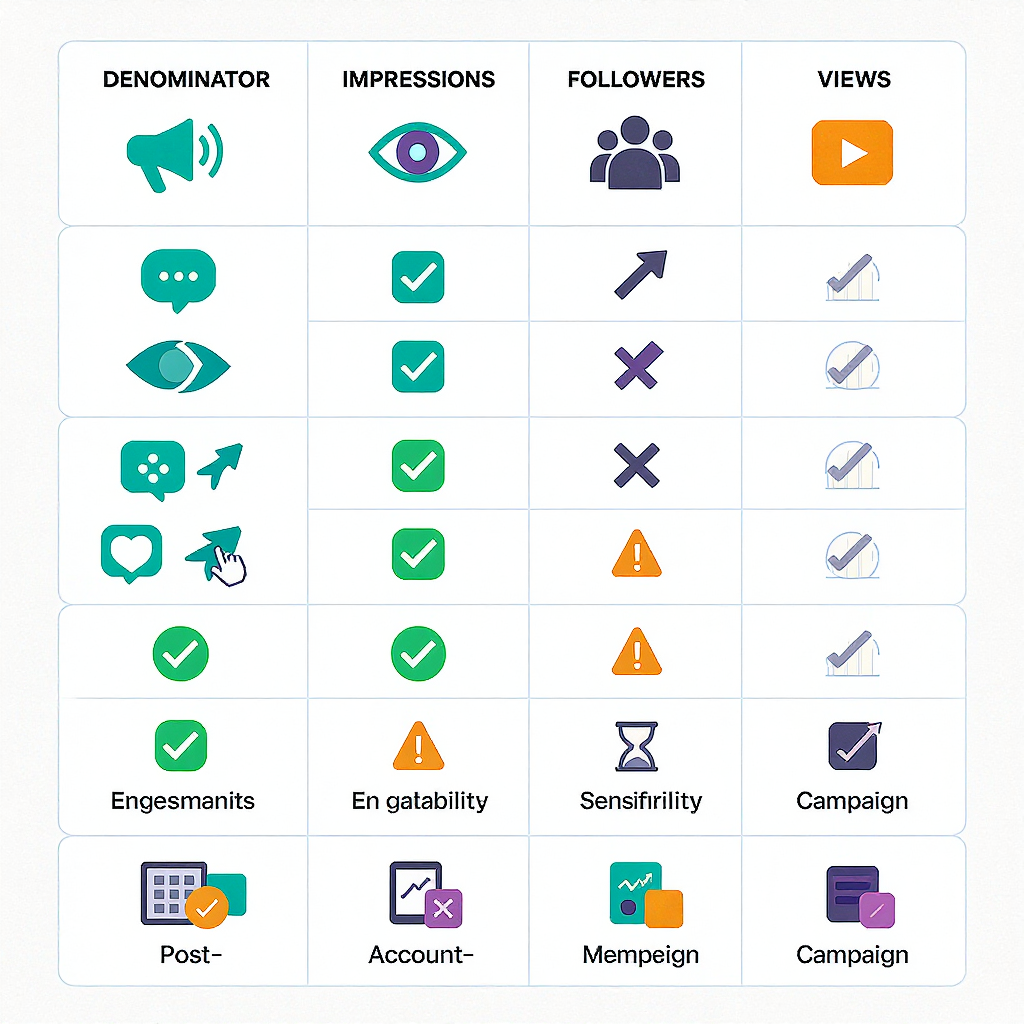
Channel-Specific Approaches and Recommended Denominators
| Platform | Count as Engagement | Recommended Denominator | Notes |
|---|---|---|---|
| Likes, comments, shares, saves; for Stories: replies, link/sticker taps | Reach (post/reel/story), Followers (account) | Include saves; for Stories, track completion per frame alongside ERr | |
| TikTok | Likes, comments, shares, favorites, profile visits; consider follows gained | Views (video), Reach when available | Also report watch time, rewatches, completion; ER by views is common |
| YouTube | Likes, comments, shares, subscribes gained | Views or Unique viewers | Always pair with average % viewed, AVD, CTR on thumbnails |
| Reactions, comments, shares, link clicks | Impressions (post), Followers (page), Unique video viewers | Clicks matter for B2B; track CTR and ERi together | |
| X (Twitter) | Likes, replies, retweets, quotes, link clicks, bookmarks, profile visits | Impressions | ERi is standard due to timeline frequency |
| Reactions, comments, shares, link clicks, button clicks | Reach (organic), Impressions (paid) | Use post clicks carefully; avoid double-counting click subtypes |
Step-by-Step Calculations with Sample Numbers
Let’s walk through a single post and a small campaign.
Single Instagram Post
- Followers: 10,000
- Reach: 3,200
- Impressions: 3,800
- Engagements:
- Likes 120
- Comments 15
- Shares 20
- Saves 35
- Link clicks 40
- Total engagements = 230
Formulas:
- ERf = 230 / 10,000 = 2.30%
- ERr = 230 / 3,200 = 7.19%
- ERi = 230 / 3,800 = 6.05%
In Sheets/Excel, assuming columns:
- A: Followers
- B: Reach
- C: Impressions
- D: Likes
- E: Comments
- F: Shares
- G: Saves
- H: Link_Clicks
- I: Total_Engagements
Use:
I2 = SUM(D2:H2)
ERf = I2 / A2
ERr = I2 / B2
ERi = I2 / C2
Formatting as percentages:
=IFERROR(I2/A2,0)
=IFERROR(I2/B2,0)
=IFERROR(I2/C2,0)
Multi-Post Campaign (5 Posts)
- Sum engagements across posts: SUM(I2:I6)
- Use unique reach for the entire campaign if available from the platform/ad manager.
- If not available, prefer ERi for roll-ups to avoid overstating with non-deduped reach.
Example:
- Total engagements (5 posts) = 1,420
- Unique campaign reach = 18,500
- Total impressions = 26,900
Campaign_ERr = 1420 / 18500 = 7.68%
Campaign_ERi = 1420 / 26900 = 5.28%
Account-Level (30 Days)
- Sum engagements for all posts in 30 days.
- Denominator options:
- Unique account reach (best)
- Total impressions (stable fallback)
- Followers at period end (simple but less precise)
Sample spreadsheet columns for a reusable template:
- Date, Platform, Post_ID, Format (image, reel, story, video), Objective, Followers_at_Post, Reach, Impressions, Views (video), Likes, Comments, Shares, Saves, Clicks, Profile_Visits, Subs_Gained/Follows_Gained, Total_Engagements, ERf, ERr, ERi, Avg_%_Viewed (video), Completions (video/story)
Example formulas:
Total_Engagements = SUM(Likes:Profile_Visits) + Subs_Gained
ERf = IFERROR(Total_Engagements / Followers_at_Post, 0)
ERr = IFERROR(Total_Engagements / Reach, 0)
ERi = IFERROR(Total_Engagements / Impressions, 0)
Video and Ephemeral Formats (Reels, Shorts, Stories)
Video adds attention depth to engagement rate.
- Denominator choices:
- Views: Most direct for short-form platforms (TikTok, Reels, Shorts).
- Reach or unique viewers: Use when available and deduped.
- Impressions: Good for in-feed long-form previews or ads.
- Companion metrics:
- Completion rate = Completions ÷ Views
- Average % viewed (APV) = Avg watch time ÷ Video length
- Rewatches: On some platforms, suggests strong interest; include as a diagnostic, not an engagement count.
- Retention curve: Identify drop-off points; optimize hooks and pacing.
Stories and Multi-Frame Sequences
- Frame ERr = (Replies + Link taps + Sticker taps) ÷ Frame reach
- Story completion rate = Viewers of last frame ÷ Viewers of first frame
- Weighted completion across frames:
Weighted_Completion = SUMPRODUCT(Frame_Views, Frame_Completion) / SUM(Frame_Views)Short-Form Reels/Shorts
- ER by views = (Likes + Comments + Shares + Saves + Follows_Gained) ÷ Views
- Report alongside APV and 3-sec/5-sec hold rates if available.
YouTube Specifics
- Interaction ER by views + Subscriber conversion rate (Subs gained ÷ Views)
- Pair with CTR (impressions-to-views) and AVD/APV for a fuller picture.
Reporting and Tooling
Data Sources and Exports
- Instagram/Facebook: Meta Business Suite, Insights, Graph API
- TikTok: Analytics dashboard, CSV exports, API (with app scope and rate limits)
- YouTube: Studio analytics, API, direct Looker Studio connector
- LinkedIn: Page analytics export, Ads reporting, API with sampling caveats
- X (Twitter): Analytics export, Ads Manager, API access limits vary
Best Practices
- Export CSVs regularly; maintain a clean, normalized schema across platforms.
- Use UTMs for off-platform clicks. Standardize source/medium/campaign/content so you can connect engagement to site outcomes.
- Build dashboards in Looker Studio, Power BI, or Tableau. Create calculated fields for ERr and ERi to avoid spreadsheet errors.
- Be aware of sampling/aggregation: some APIs sample data or restrict historical depth.
- Reach deduplication: Unique reach across multiple posts is not simply SUM of post reach. Where deduped reach isn’t available, default to impressions for roll-ups, and document the limitation.
Quality Control
- Check for double-counted clicks (e.g., Facebook total clicks vs link clicks vs other clicks).
- Align time zones across exports.
- Freeze follower counts at post time when computing ERf for historical accuracy.
Benchmarks and Targets
Benchmarks vary by niche, creative quality, audience size, and whether the content is organic or paid. Treat ranges as directional, then set targets based on your own baseline and goals.
| Platform | Organic ER (typical) | Paid ER (typical) | Notes |
|---|---|---|---|
| Instagram (Feed/Reels) | By Reach: 1–5% (Feed), 2–8% (Reels) | By Impressions: 0.3–1.5% | Saves and shares often correlate with future reach |
| TikTok | By Views: 4–15% | By Views: 1–4% | Watch time strongly moderates distribution |
| YouTube | By Views: 0.5–5% interactions | By Views: 0.2–2% | APV 35–55% common for short videos; varies with length |
| By Impressions: 0.5–3% | By Impressions: 0.2–1% | Clicks/CTR (0.4–1.5%) crucial for B2B content | |
| X (Twitter) | By Impressions: 0.5–2.5% | By Impressions: 0.3–1.2% | Quote tweets often signal deeper engagement |
| By Reach: 0.5–2% | By Impressions: 0.2–1% | Clicks can dominate on link posts |
Contextual Factors
- Audience size: Smaller, niche accounts often exhibit higher ER; rates tend to compress as audiences scale.
- Organic vs paid: Paid typically shows lower ER but scales reach efficiently; judge paid by cost per engagement and downstream KPIs.
- Seasonality and campaign context: Expect spikes during launches or events; normalize against prior comparable periods.
Common Pitfalls to Avoid
- Mixing denominators: Don’t compare ERr to ERi without labeling; keep apples-to-apples.
- Double-counting engagements: Avoid summing “total clicks” and “link clicks” together.
- Including vanity actions that don’t match goals: Define what “counts” per objective.
- Bots and giveaways: Contests can inflate likes and follows; segment or exclude when benchmarking.
- Comparing unlike accounts: Niche vs mass-market, regional vs global, media types (video vs static) all skew ER.
- Small samples: One viral post can distort averages; use medians and distribution percentiles for robustness.
- Ignoring watch time: For video, likes-only ER misses the story; include completion and retention.
How to Improve Engagement Rate
Content Strategy
- Mix formats: Blend static, carousels, short-video, long-form, and Stories to meet different consumption modes.
- Hooks and structure: Nail the first 2–3 seconds; front-load value, pattern breaks, and curiosity loops.
- CTAs with intent: Ask for saves (“Save this checklist”), shares (“Share with a teammate”), and comments (“What’s your biggest blocker?”) aligned to content.
- Visual clarity: Optimize for mobile-first consumption; legible text, strong thumbnails, branded but not over-produced.
Publishing Tactics
- Timing and cadence: Post when your audience is active; be consistent without fatiguing frequency.
- Community management: Reply fast, ask follow-up questions, and elevate UGC; comments beget comments.
- Accessibility: Add captions/subtitles; descriptive alt text; inclusive language widens engagement.
- Collaborations: Co-create with partners/creators; borrowed relevance boosts reach and ER.
Optimization Workflow
- A/B test thumbnails, hooks, CTAs, length, and topic angles.
- Maintain a learning agenda: Hypothesis -> Test -> Measure -> Document -> Roll-out.
- Segment reporting by format, topic, and audience cohort to uncover pockets of strong ER.
- Close the loop: Use UTMs and site analytics to validate that higher ER aligns with downstream KPI improvements.
Quick Reference: Choosing the Right ER
- Want to compare creators or brands? Use ERf but sanity-check against ERr for distribution effects.
- Want to understand interaction among exposed audiences? Use ERr (post or campaign).
- Running paid with variable frequency? Use ERi and pair with cost per engagement and frequency.
- Video-first channels? Report ER by views plus completion rate and APV.
Summary
Engagement rate measures how effectively your content sparks interaction among the people who see it. Define what counts as engagement, choose a denominator that matches your goal and channel, and pair ER with attention-depth metrics like completion and watch time. With disciplined reporting, deduped reach where possible, and a test-and-learn workflow, you can improve ER and link it to real business outcomes.