How to Calculate Facebook Engagement Rate Step by Step
Learn how to calculate Facebook engagement rate with formulas, examples, and benchmarks to measure and improve your content performance.
Understanding Facebook Engagement Rate
If you are aiming to grow your brand on social media, knowing how to calculate engagement rate on Facebook is essential. This metric shows how actively your audience interacts with your posts and provides insight into the effectiveness of your content strategy. Every like, comment, share, save, or click signals a connection with your audience — and understanding this number helps you make informed marketing decisions. In this guide, we’ll break down definitions, formulas, examples, benchmarks, and best practices so you can track and improve your Facebook engagement rate effectively.

---
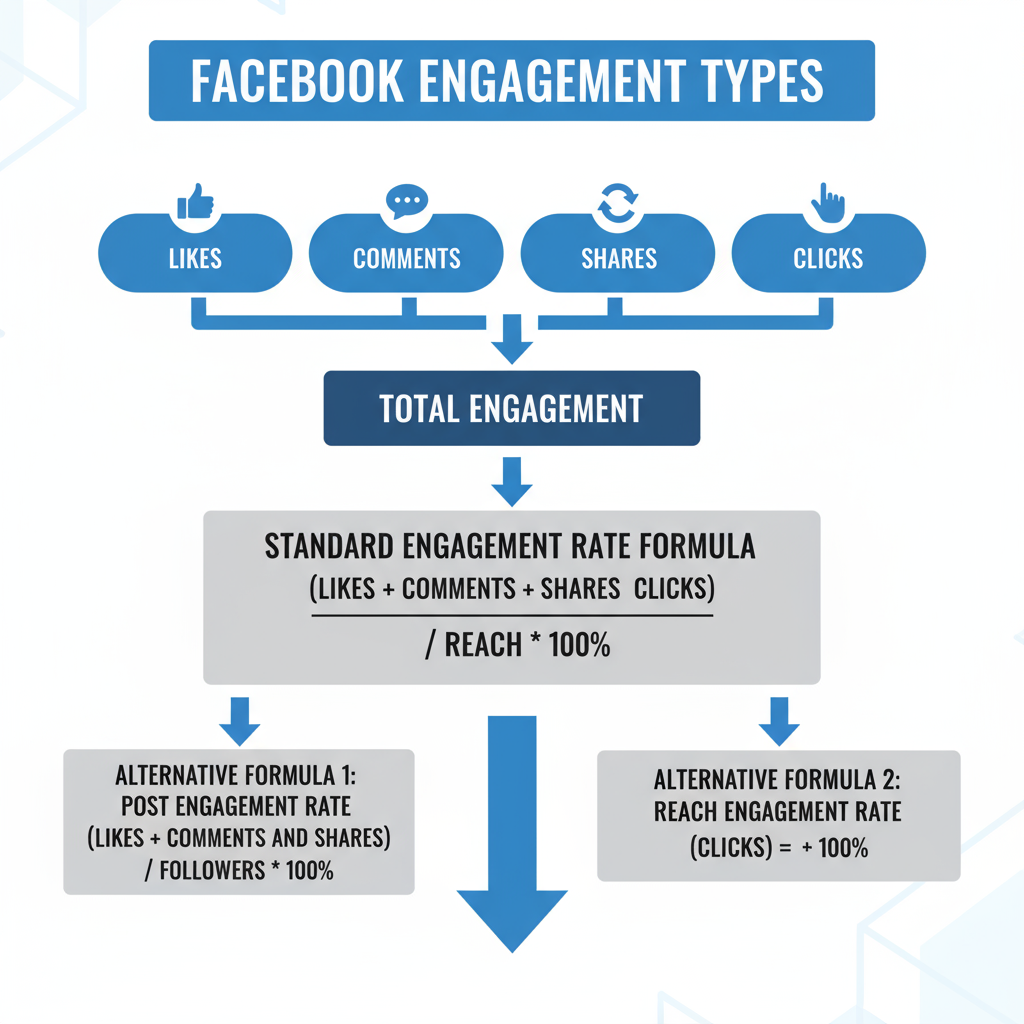
Types of Engagement on Facebook
Facebook supports multiple interaction formats, all of which can count toward engagement. The main types include:
- Reactions: Likes, loves, wows, sads, angries (all reaction emojis).
- Comments: Written responses to a post.
- Shares: Posting your content to one’s own timeline, page, or group.
- Saves: Storing content for future viewing.
- Clicks: Link clicks, photo views, video plays, and other click actions.
Each type reflects a different level of engagement — for example, a share is generally considered a stronger endorsement than a simple like.
---
The Standard Formula for Engagement Rate
The most widely used calculation is:
Engagement Rate (%) = (Total Engagements / Total Reach) x 100Where:
- Total Engagements = Reactions + Comments + Shares + Saves + Clicks
- Total Reach = Number of unique users who saw the post
This gives an engagement rate per reach, showing the percentage of reached users who engaged with your content.
---
Alternative Formulas for Engagement Rate
Different scenarios may call for different denominators in your calculation:
| Formula Type | Calculation | Use Case |
|---|---|---|
| Per Followers | (Total Engagements / Total Followers) x 100 | Useful for comparing brands of different audience sizes |
| Per Impressions | (Total Engagements / Total Impressions) x 100 | Suited for paid campaigns focusing on impressions |
| Per Post Reach | (Total Engagements / Post Reach) x 100 | Ideal for analyzing the performance of individual posts |
> Tip: Stay consistent in your chosen formula and specify it in your reports — changing methods mid-way will distort comparisons.
---
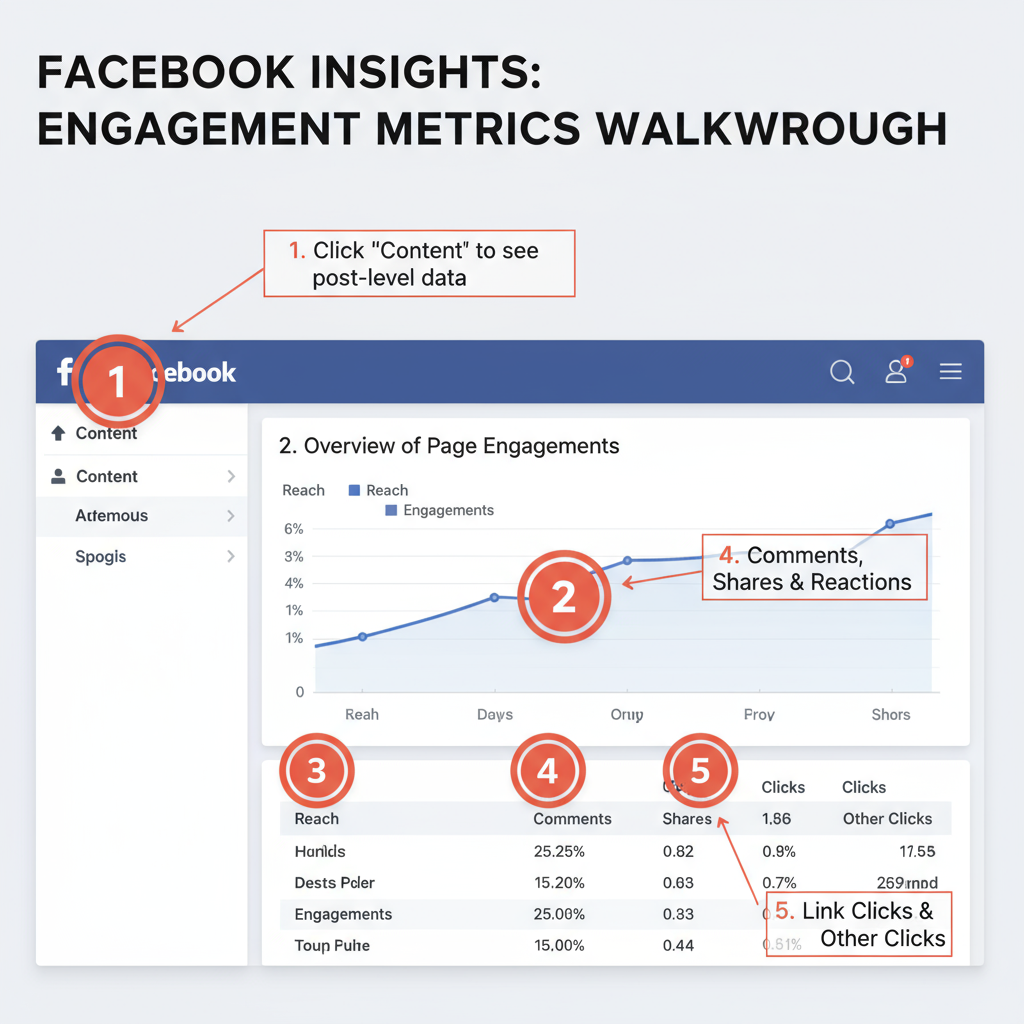
Step-by-Step: Gathering Engagement Metrics from Facebook Insights
You can find all the required numbers inside Meta Business Suite (formerly Facebook Insights):
- Log in to your Facebook Page.
- Go to Meta Business Suite or directly open Insights.
- Choose the Content tab to view metrics for each post.
- Identify Reach (or Impressions, if that’s your chosen denominator).
- Sum up engagement actions: reactions, comments, shares, saves, clicks.
- Record this data in a spreadsheet for calculation.
For multiple posts, use the Export Data (CSV) option to save time.
---
Example Calculation with Real Numbers
Suppose a post from June generated:
- Reach: 5,000
- Likes/Reactions: 200
- Comments: 50
- Shares: 30
- Clicks: 120
Step 1: Total engagements
200 + 50 + 30 + 120 = 400Step 2: Apply the formula
Engagement Rate = (400 / 5,000) x 100
                = 8%
An 8% engagement rate is generally considered strong, though ideal rates vary by industry.
---
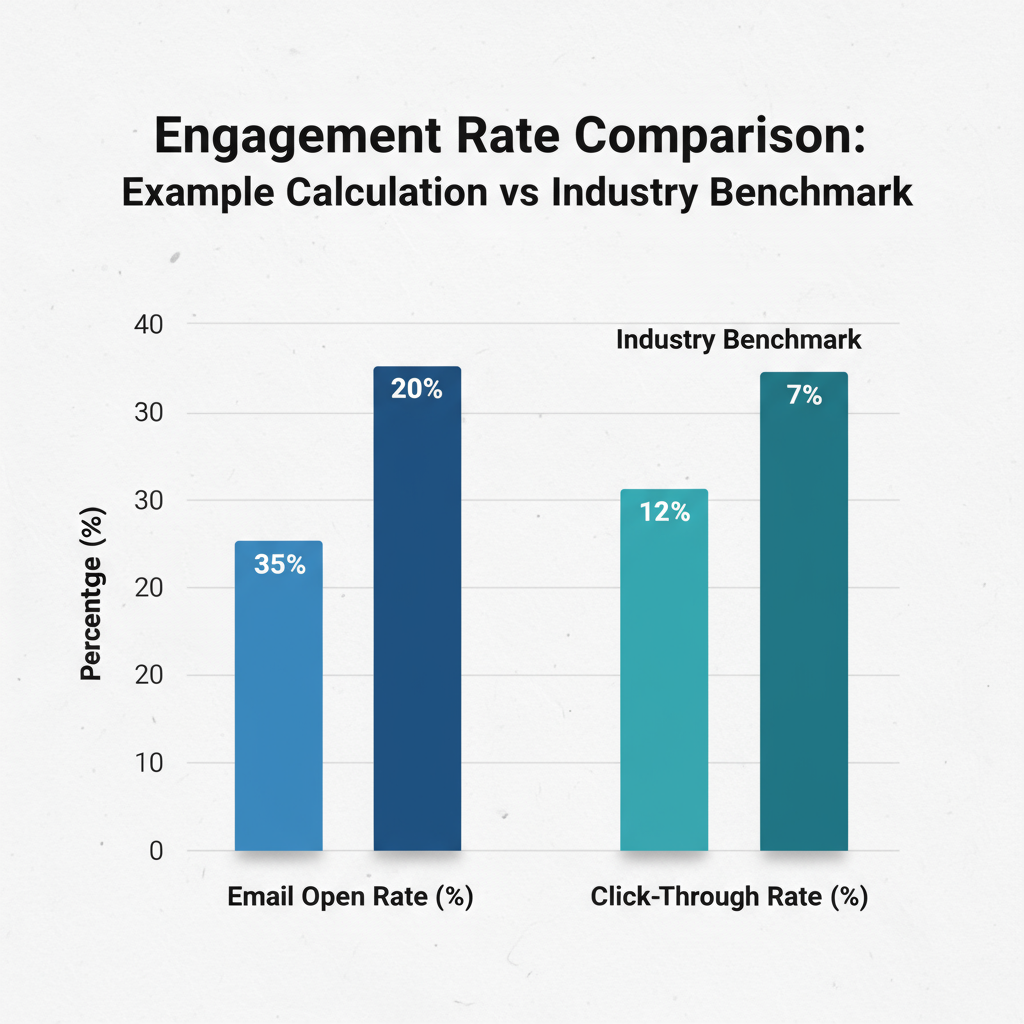
Industry Benchmarks for Facebook Engagement Rate
| Industry | Average Engagement Rate (%) |
|---|---|
| Non-profits | 6.3 |
| Media & Publishing | 4.4 |
| Retail | 3.9 |
| Education | 5.8 |
| Technology | 2.5 |
> Use these figures as references — always measure yourself against peers in your own industry for the most relevant insight.
---
Common Mistakes in Calculating Facebook Engagement Rate
Avoid these frequent errors when figuring out how to calculate engagement rate on Facebook:
- Mixing Reach and Impressions: Reach is unique users; impressions include repeats.
- Leaving Out Engagement Types: Excluding clicks or saves underreports engagement.
- No Defined Timeframe: Comparing data from inconsistent periods skews results.
- Switching Formulas: Changing from per reach to per followers without noting will distort trends.
---
Using Insights to Improve Engagement
Once you know your engagement rate, use the insight to take action:
- Spot High-Performing Content: Study what topics, visuals, or formats perform best.
- Test Different Formats: Alternate between videos, carousels, live streams, polls.
- Optimize Timing: Post at peak times shown in your analytics.
- Promote Interaction: Ask questions, create contests, and use strong calls-to-action.
- Trend Monitoring: Track changes monthly or weekly to detect shifting audience habits.
---
Tools to Track Engagement Rate Automatically
Manual calculations get harder as you scale. Consider automation:
- Free:
- Facebook Insights (native)
- Google Data Studio connectors
- Metricool (free plan)
- Paid:
- Sprout Social
- Hootsuite Analytics
- Socialbakers
- Agorapulse
These connect to Facebook’s API and produce ready-to-use visual reports.
---
Best Practices for Engagement Rate Reporting
Ensure your reports remain clear, useful, and comparable over time:
- Fix a Standard Formula and stick to it.
- Automate Calculations when possible.
- Benchmark Regularly against updated industry averages.
- Reuse Templates for efficient reporting.
- Add Qualitative Notes to explain performance deviations.
---
Summary and Next Steps
Mastering how to calculate engagement rate on Facebook equips you with the data to make smart choices about your content strategy. You’ve learned the key engagement types, formulas, benchmarks, and reporting best practices.
Start by collecting accurate data from Meta Business Suite, apply a consistent formula, compare results with industry norms, and adjust your creative and posting strategy accordingly. Over time, consistent tracking leads to sharper insights and a more loyal, engaged audience.
Ready to improve your Facebook marketing? Apply these calculation methods today and start boosting your engagement rate.