How to Calculate Facebook Engagement Rate with Formulas
Learn how to calculate Facebook engagement rate using key formulas, extract accurate data from Facebook Insights, and avoid common mistakes.
How to Calculate Facebook Engagement Rate with Formulas
Accurately calculating Facebook engagement rate is essential for marketers, social media managers, and business owners who want to assess how audiences interact with their content. This metric isn’t just a vanity number—it reveals how captivating your posts are, helps optimize campaigns, and guides data-driven decisions. In this guide, you’ll learn what engagement rate means, the formulas to use, how to get the data, and strategies to improve performance.
---
What Is Engagement Rate and Why It Matters
Facebook engagement rate measures the level of interaction your audience has with your posts compared to either the number of followers or the reach. It aggregates likes, comments, shares, and clicks into a percentage that reflects how engaging your content is.
Why it matters:
- Audience Resonance – A strong rate suggests your content matches audience interests.
- Algorithm Boost – Meta’s algorithm prioritizes posts with higher engagement.
- Campaign ROI – Helps quantify the value of your social media investments.

---
Breakdown of Facebook Engagement Metrics
Before calculating the rate, understand what counts as engagement:
- Likes & Reactions – Indicators of instant approval or emotional connection.
- Comments – Provide feedback and stimulate conversation.
- Shares – Extend reach beyond your follower base.
- Clicks – Link visits, media views, and interaction with post elements.
Tracking each type separately helps spot which form of engagement your audience prefers.
---
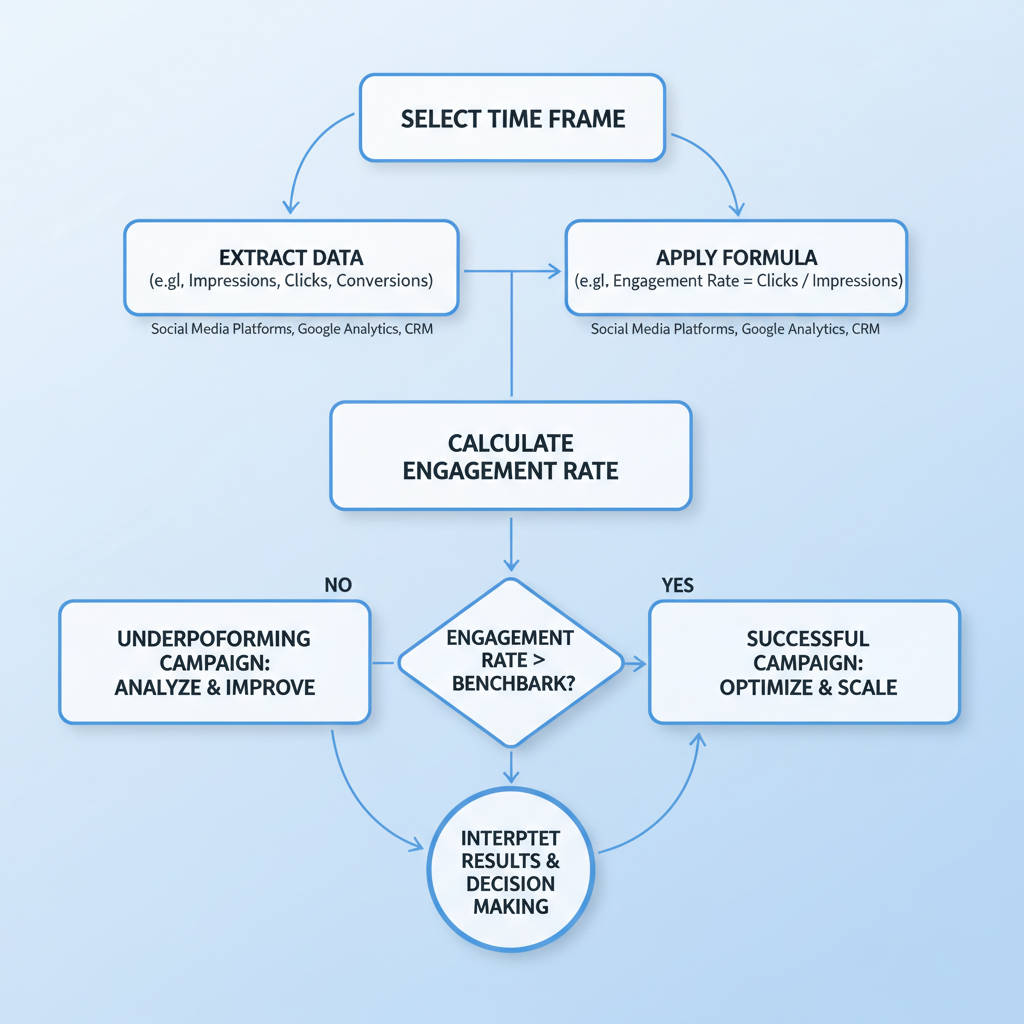
Choosing a Time Frame for Analysis
For accurate comparisons, define a measurement period and use it consistently:
- Daily – Ideal for short campaigns or quick monitoring.
- Weekly – Balances granularity and trend detection.
- Monthly – Offers a broader strategic view.
Consistency allows better identification of patterns and performance shifts.
---
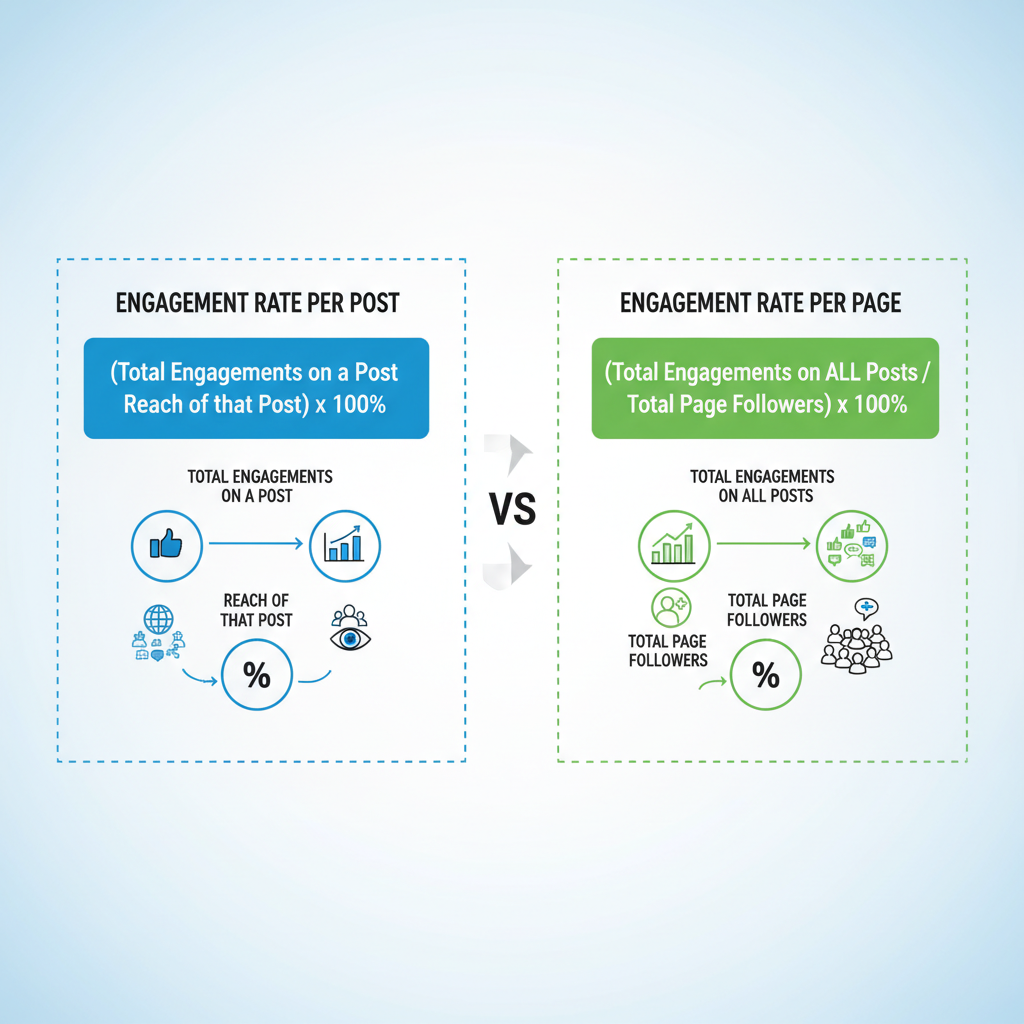
Formula 1: Engagement Rate per Post
To measure engagement for one post relative to reach:
Engagement Rate per Post (%) = (Total Engagements ÷ Total Reach) × 100Where:
- Total Engagements = sum of likes, comments, shares, clicks.
- Total Reach = unique users who viewed the post.
This highlights how compelling a single post was to the viewers it reached.
---
Formula 2: Engagement Rate per Page
To measure overall page engagement relative to followers:
Engagement Rate per Page (%) = (Total Engagements ÷ Total Followers) × 100Where:
- Total Engagements = sum of all post engagements in the time frame.
- Total Followers = current follower count.
Useful for tracking brand health and long-term performance.
---
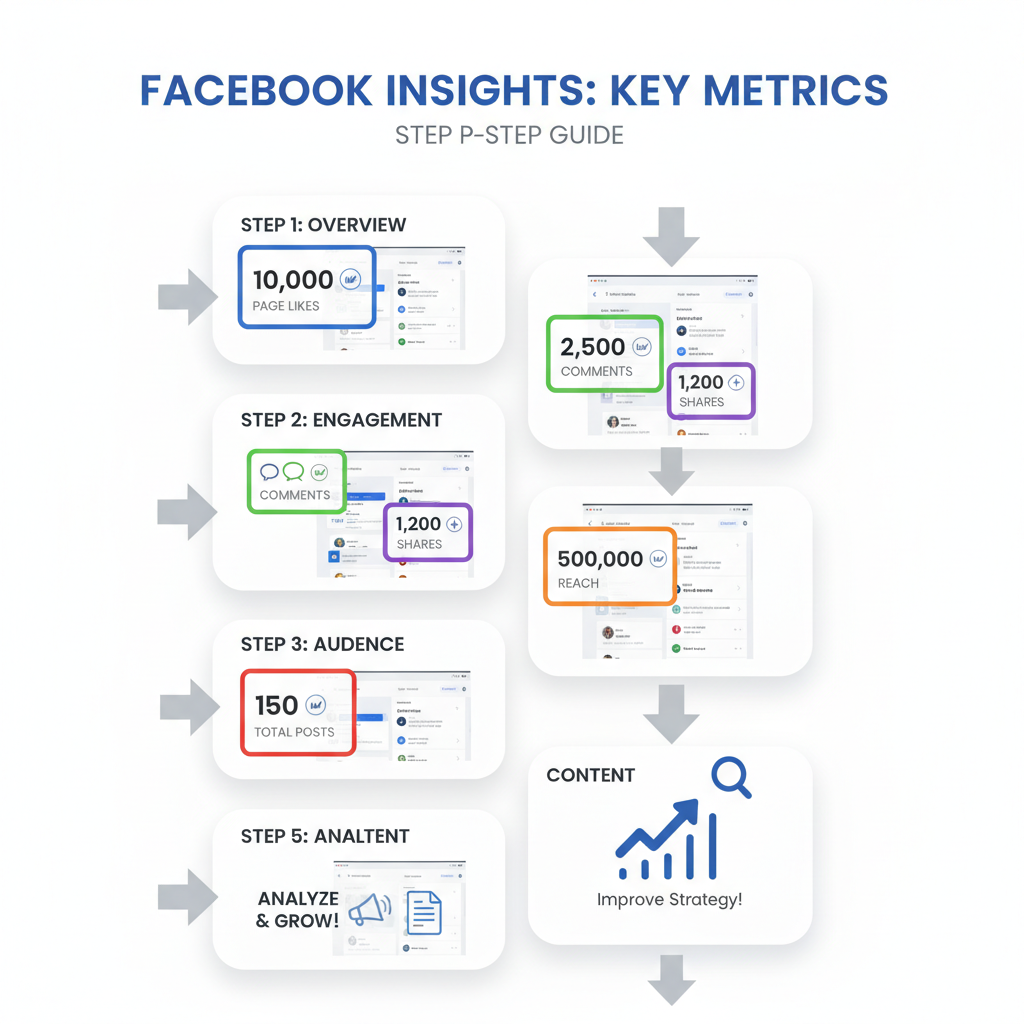
How to Extract Data from Facebook Insights
Facebook Insights offers engagement data you can export:
- Log In to Facebook and open your page.
- Click Insights on the left.
- Select Posts for individual post data.
- Set your date range.
- Click Export Data.
- Choose Post-level or Page-level.
- Save as CSV or Excel.
Remember: reach counts unique users; impressions counts total views.
---
Real-World Example Calculation
Example using Formula 1:
| Post Date | Likes | Comments | Shares | Clicks | Total Reach |
|---|---|---|---|---|---|
| 2024-05-01 | 120 | 30 | 20 | 80 | 5,000 |
Step 1: Total Engagements = 120 + 30 + 20 + 80 = 250
Step 2:
Engagement Rate (%) = (250 ÷ 5,000) × 100 = 5%Result: 5% of users reached engaged with the content.
---
Common Mistakes to Avoid
Avoid these errors when calculating:
- Mixing Reach and Impressions – Match the formula’s requirement.
- Double Counting – Tally each action once.
- Inconsistent Periods – Keep time frames uniform.
- Leaving Out Interaction Types – Include likes, comments, shares, clicks.
---
Tools and Spreadsheets to Automate Calculations
Save time by automating:
- Excel or Google Sheets – Import CSVs and use formulas.
- Social Media Tools – Platforms like Sprout Social or Hootsuite auto-calculate engagement.
- Custom Scripts – Python or R for processing large data sets.
Google Sheets formula example:
= (SUM(B2:E2) / F2) * 100Where B2:E2 = engagement counts, F2 = reach.
---
Interpreting Results and Benchmarking
Add context by comparing with industry benchmarks:
| Industry | Average Engagement Rate (%) |
|---|---|
| Retail | 2.5 |
| Education | 4.0 |
| Nonprofit | 5.5 |
Above-average? You’re outperforming peers. Below-average? Explore optimization tactics.
---
Strategies to Improve Low Engagement Rates
Boost engagement by:
- Posting at Optimal Times – When your audience is online.
- Enhancing Visual Appeal – Use strong images or videos.
- Interacting – Reply to comments promptly.
- Testing Formats – Try stories, live videos, carousels.
- Creating Shareable Content – Focus on topics worth sharing.
---
Monitoring Engagement Trends Over Time
Track your engagement consistently to:
- Detect seasonal or campaign-driven changes.
- Correlate spikes or dips with content types.
- Fine-tune posting frequency and messaging.
Use dashboards or scheduled reports for continuous insight.
---
Summary
Understanding how to calculate Facebook engagement rate—at both the post and page level—lets you evaluate content effectiveness and refine strategies. By exporting accurate data from Facebook Insights, applying well-defined formulas, and benchmarking against industry averages, you can pinpoint strengths and weaknesses.
Next step: Download your latest engagement data and run these calculations today to unlock actionable insights that can elevate your social media impact and ROI.