How to Calculate Facebook Engagement Rate Step by Step
Learn what Facebook engagement rate is, the key formulas, and step-by-step instructions to calculate it manually for accurate social media insights.
How to Calculate Facebook Engagement Rate Step by Step
Understanding how to calculate Facebook engagement rate is essential for marketers who want to measure their social media success with accuracy. This metric reflects how actively your audience interacts with your posts, and it serves as a key indicator of relevance, content quality, and brand resonance.
In this guide, we’ll break down exactly what Facebook engagement rate is, why it matters, the formulas you can use, and the steps to calculate it—plus expert tips to improve it over time.
Whether you manage a small business page or oversee a global brand’s social strategy, calculating, interpreting, and optimizing this metric helps refine your campaigns for better results.

---
What Is Facebook Engagement Rate and Why It Matters
Facebook Engagement Rate is the percentage of people who interact with your content relative to a specific base—such as reach, impressions, or total followers. It measures how compelling and relevant your content is to the people who see it.
Why It Matters for Marketers
- Performance Indicator – Shows how well your posts resonate with your audience.
- Algorithm Influence – Higher engagement signals to Facebook’s algorithm that your content should be shown to more users.
- ROI Insight – Helps determine whether your content generates enough audience action to justify the cost.
- Content Strategy Feedback – Provides insight on what works to guide future posts and improve audience retention.
---
Engagement Metrics to Track
The “engagement” part of the formula can include many interaction types beyond simple likes. Facebook engagement includes:
- Reactions (like, love, haha, wow, sad, angry)
- Comments (direct responses to your posts)
- Shares (users sharing your content to their own audience)
- Click-throughs (clicking links, photos, videos, CTAs)
- Saves (bookmarking content for later viewing)
- Messenger Clicks (initiating a message from a post)
| Engagement Type | Description | Value for Marketers |
|---|---|---|
| Reactions | Expressed feelings toward content | Gauge audience sentiment |
| Comments | Written responses from users | Indicates deeper interaction |
| Shares | Content reshared to another’s network | Boosts organic reach |
| Clicks | Links, images, video plays, CTA clicks | Drives traffic to destinations |
| Saves | Marked for later viewing | Reflects relevancy and value |
---
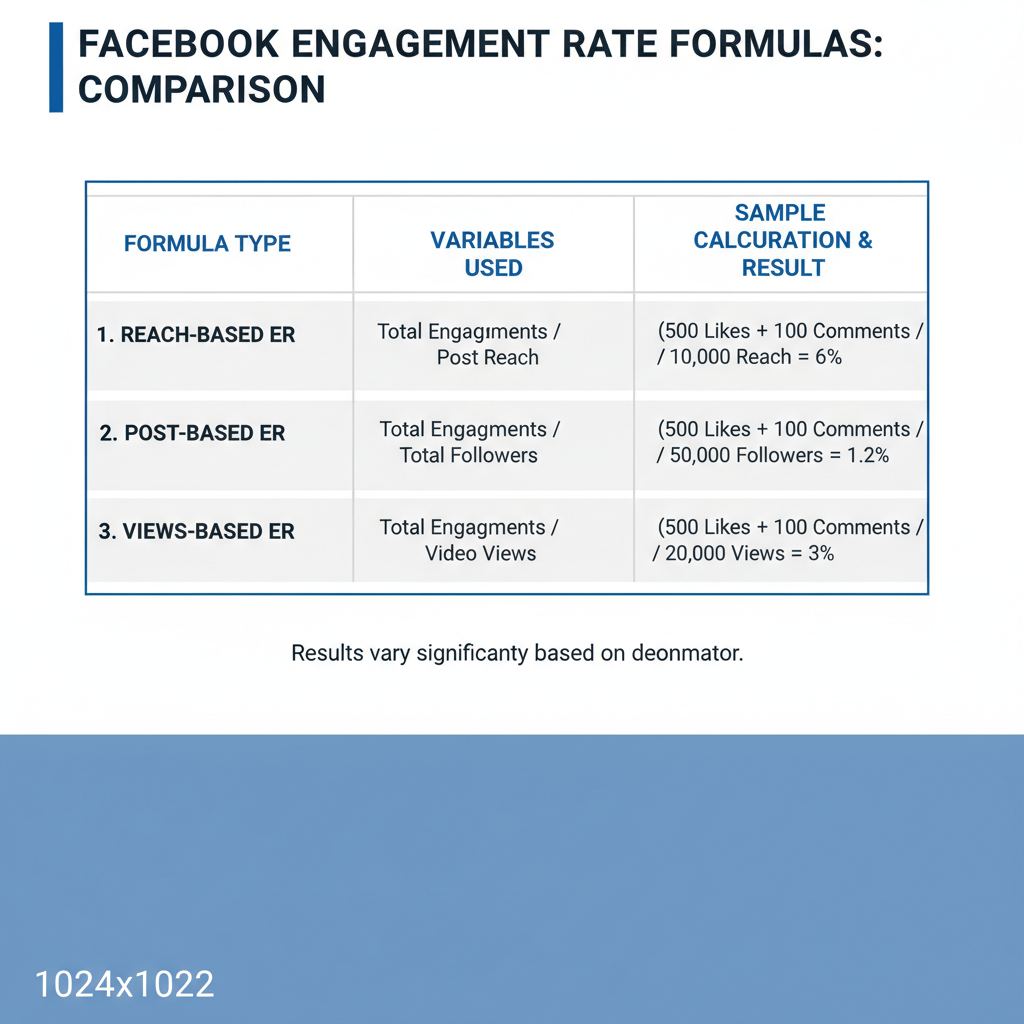
Common Formulas for Facebook Engagement Rate
Here are three primary ways to calculate engagement rate, each using a different baseline.
- Engagement Rate by Reach (ERR)
ER by Reach = (Total Engagements / Reach) x 100Best for understanding audience resonance relative to actual viewers.
- Engagement Rate by Impressions (ERI)
ER by Impressions = (Total Engagements / Impressions) x 100Useful when measuring ad campaigns or boosted posts.
- Engagement Rate by Followers (ERF)
ER by Followers = (Total Engagements / Followers) x 100Ideal for long-term growth tracking; less influenced by individual post reach.
---
Step-by-Step Method to Calculate Engagement Rate Manually
Follow this process to calculate engagement rate without a tool:
- Select a Timeframe – Decide whether you’re analyzing a single post, campaign, or monthly summary.
- Sum Total Engagements – Add all reactions, comments, shares, clicks, and saves.
- Identify Your Baseline – Choose Reach, Impressions, or Followers based on your goals.
- Apply the Formula – Insert your numbers into the chosen calculation.
- Calculate the Percentage – Multiply by 100 to get the percentage result.
Example:
- Total Engagements: 350
- Reach: 5,000
ER by Reach = (350 / 5000) x 100
ER by Reach = 0.07 x 100 = 7%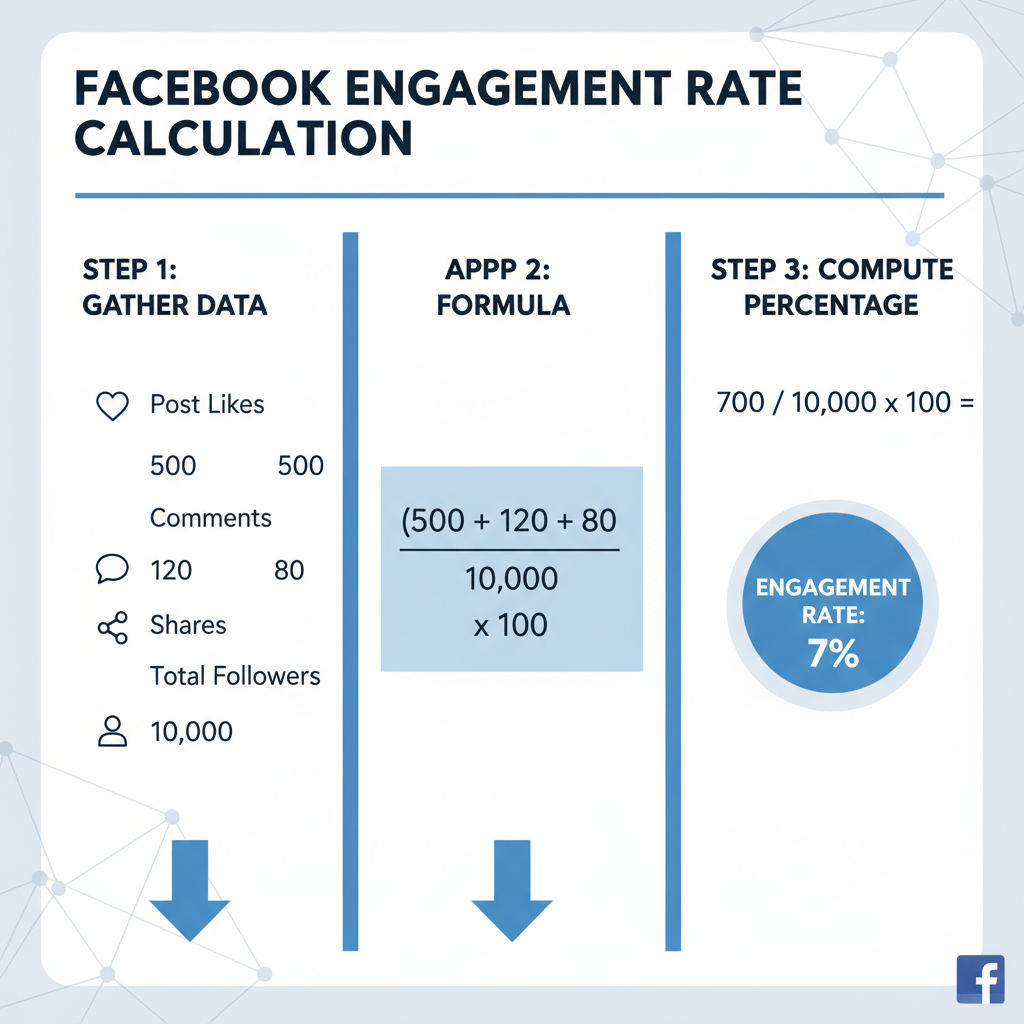
---
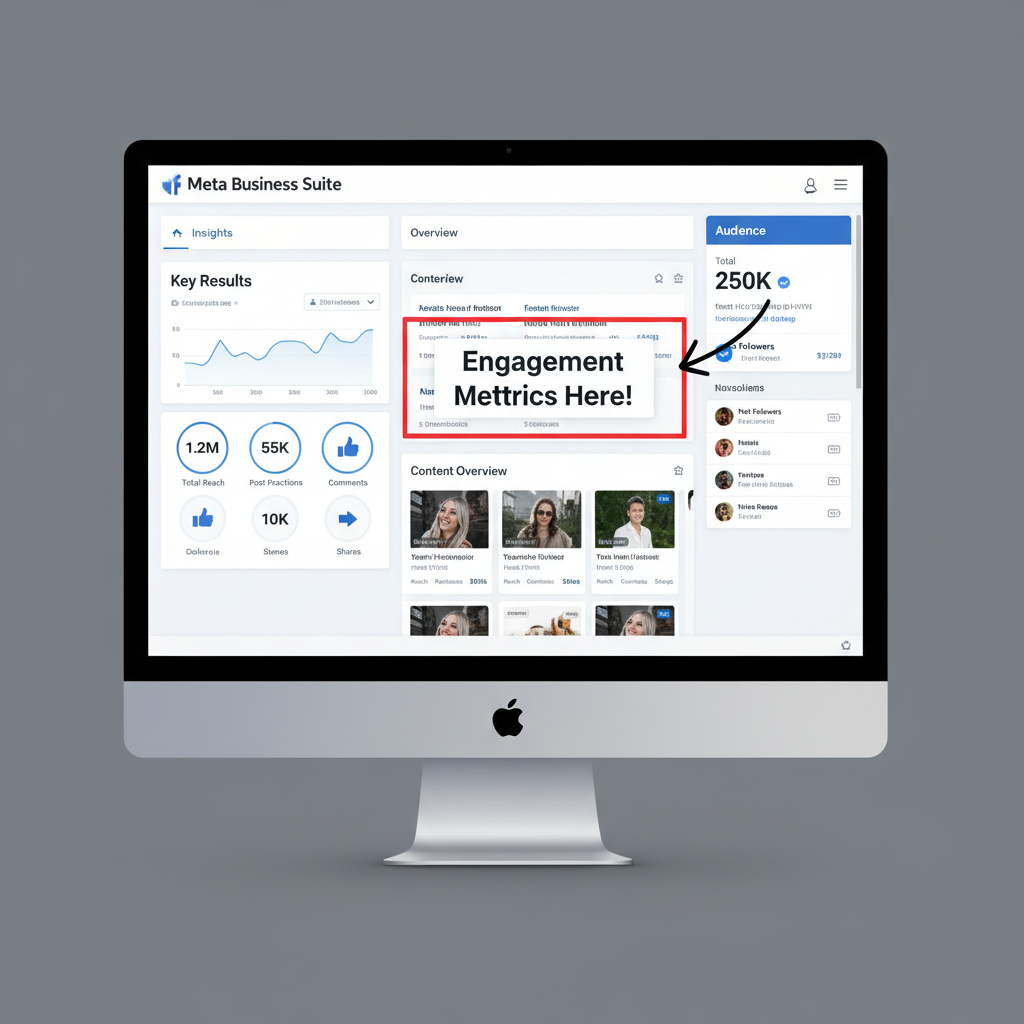
Using Facebook Insights to Gather Accurate Data
Facebook’s built-in Insights tool is invaluable for engagement tracking. Access it by:
- Going to your Facebook Page.
- Clicking Insights in the left-hand menu.
- Selecting Posts or Content to access detailed data.
Insights provides:
- Post reach & impressions
- Engagement breakdown by type
- Audience demographics
- Historical performance charts
Pro Tip: Use the "Post Types" report to identify which formats deliver the highest engagement rate.
---
Pros and Cons of Each Formula
| Formula | Pros | Cons |
|---|---|---|
| By Reach | Reflects real exposure; adjusts for paid boosts | Reach can vary daily, causing fluctuations |
| By Impressions | Accounts for multiple views; ideal for ads | High impressions may lower rate artificially |
| By Followers | Stable reference point over time | Ignores reach variations between posts |
---
Which Formula Should You Use?
- Campaign Optimization – Use ER by Impressions for advertising analysis.
- Page Health Check – Use ER by Followers to gauge long-term audience engagement.
- Content Testing – Use ER by Reach to identify high-performing posts.
---
Tips to Improve Engagement Rate
- Post High-Quality Media – Use clear visuals, compelling videos, and concise copy.
- Optimize Posting Times – Share content when your audience is most active.
- Encourage Interaction – Ask questions, run polls, and invite feedback.
- Use Relevant Keywords & Hashtags – Increase reach and visibility.
- Leverage Facebook Stories – Short-lived but high-engagement format.
- Test Multiple Formats – Experiment with carousels, videos, and live streams.
---
Tracking and Benchmarking Against Industry Averages
A 7% engagement rate may be excellent in some sectors but poor in others. Always compare performance against relevant benchmarks.
Example Benchmarks (illustrative only):
| Industry | Average ER (by Reach) |
|---|---|
| Retail | 3.5% |
| Nonprofit | 6.0% |
| Media | 2.0% |
| Education | 4.5% |
Steps:
- Identify your industry.
- Source up-to-date benchmark reports.
- Compare and adjust strategy accordingly.
---
Common Mistakes to Avoid
- Counting Impressions as Reach – They are different metrics entirely.
- Ignoring Negative Feedback – Hidden posts and reports suggest poor resonance.
- Overlooking Clicks – Many valuable engagements are not publicly visible.
- Mixing Baselines in Comparisons – Always use the same ER formula for comparison.
- Relying on One Metric Alone – Pair ER with conversions or watch time for fuller insight.
---
Tools for Automating Engagement Rate Calculations
Automation can save time and improve accuracy, especially for busy teams.
Popular Tools:
- Sprout Social – Detailed metrics with customizable reports.
- Hootsuite – Post scheduling and integrated analytics, including ER.
- Buffer Analyze – Visual charts and engagement trend analysis.
- Agorapulse – Bulk exports with post-level ER data.
- Facebook Business Suite – Free tool for Facebook and Instagram analytics.
---
Summary and Next Steps
Calculating Facebook engagement rate allows you to assess content performance, find what resonates with your audience, and strategically improve your social presence.
By:
- Choosing the right ER formula
- Pulling accurate data from Facebook Insights
- Comparing results against industry benchmarks
- Continuously optimizing your content strategy
…you’ll be equipped to make data-driven decisions that maximize ROI and growth.
Next Step: Start tracking your engagement rates today and test one improvement tactic this week to see its impact. Consistent measurement and iteration are the keys to Facebook marketing success.