Check Total Twitter Impressions Using Twitter Analytics
Learn how to check total Twitter impressions on desktop and mobile, understand their meaning, and use analytics to improve tweet visibility.
How to Check Total Twitter Impressions and Improve Visibility
Understanding how to check total Twitter impressions is essential for anyone seeking to track tweet visibility and refine their social media strategy. Impressions measure how often your tweet appears on users’ screens — in timelines, search results, or through retweets — and can help you evaluate exposure levels before diving into engagement metrics. This guide walks you step-by-step through accessing and interpreting impressions data on both desktop and mobile, plus offers tips to boost your reach organically.
---
Understanding Twitter Impressions
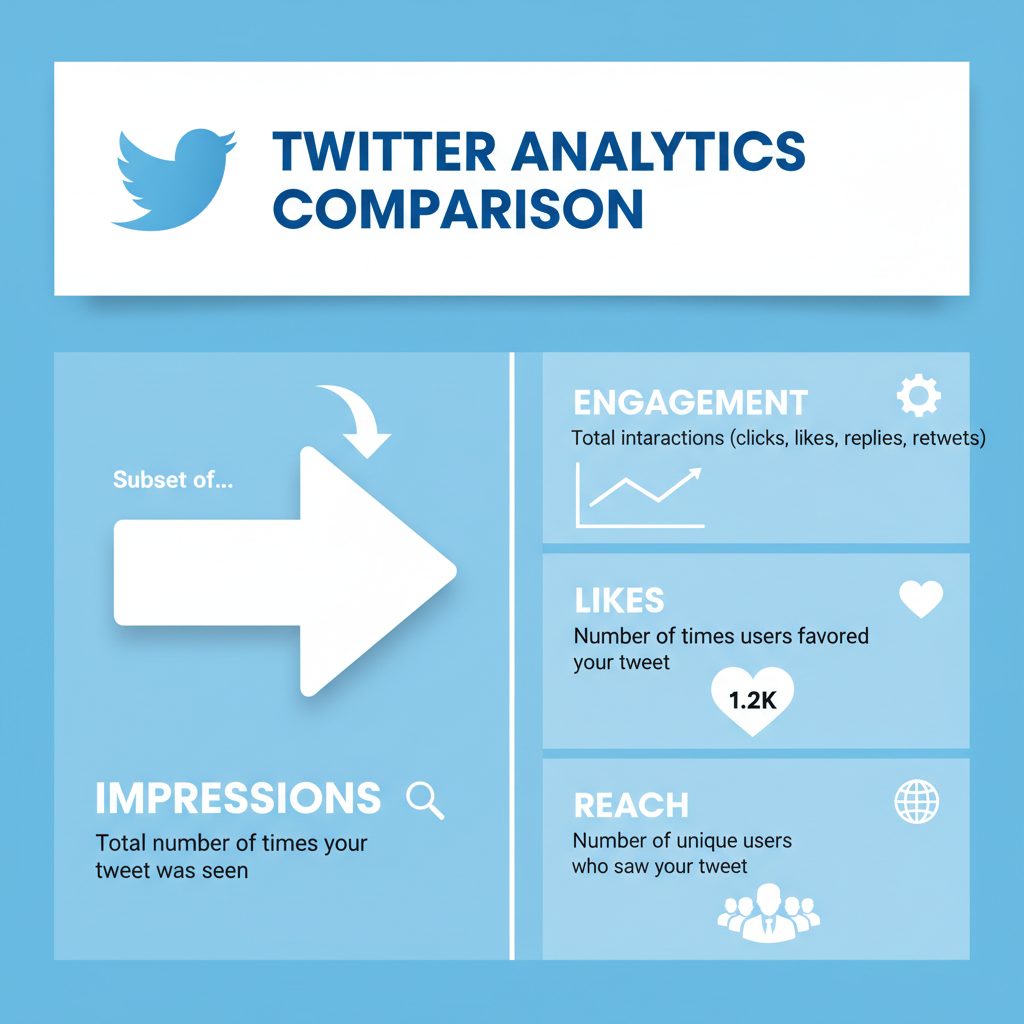
Twitter impressions represent the total number of times your tweet has been displayed on users’ screens — including in timelines, search results, and via retweets. They are a fundamental metric for gauging visibility rather than direct engagement.
Unlike engagement, impressions do not require the user to click, like, or comment; they simply measure exposure. If your tweet shows up multiple times to the same user, each view counts as a separate impression.

Impressions are calculated automatically by Twitter's systems, tracking how often your content is rendered across devices. They are not the same as reach — reach estimates unique viewers, whereas impressions count all views.
---
Impressions vs. Other Twitter Metrics
To better understand how to check total Twitter impressions, you first need to distinguish them from other metrics:
| Metric | Definition | Key Difference from Impressions |
|---|---|---|
| Engagements | Total interactions with a tweet (likes, replies, retweets, clicks) | Measures action, not passive views |
| Reach | Number of unique users who saw the tweet | Reach counts unique views; impressions count total views including repeats |
| Profile Visits | Number of times people visited your Twitter profile | Related to curiosity about your account, not the tweet visibility itself |
---
Access Twitter Analytics via Desktop
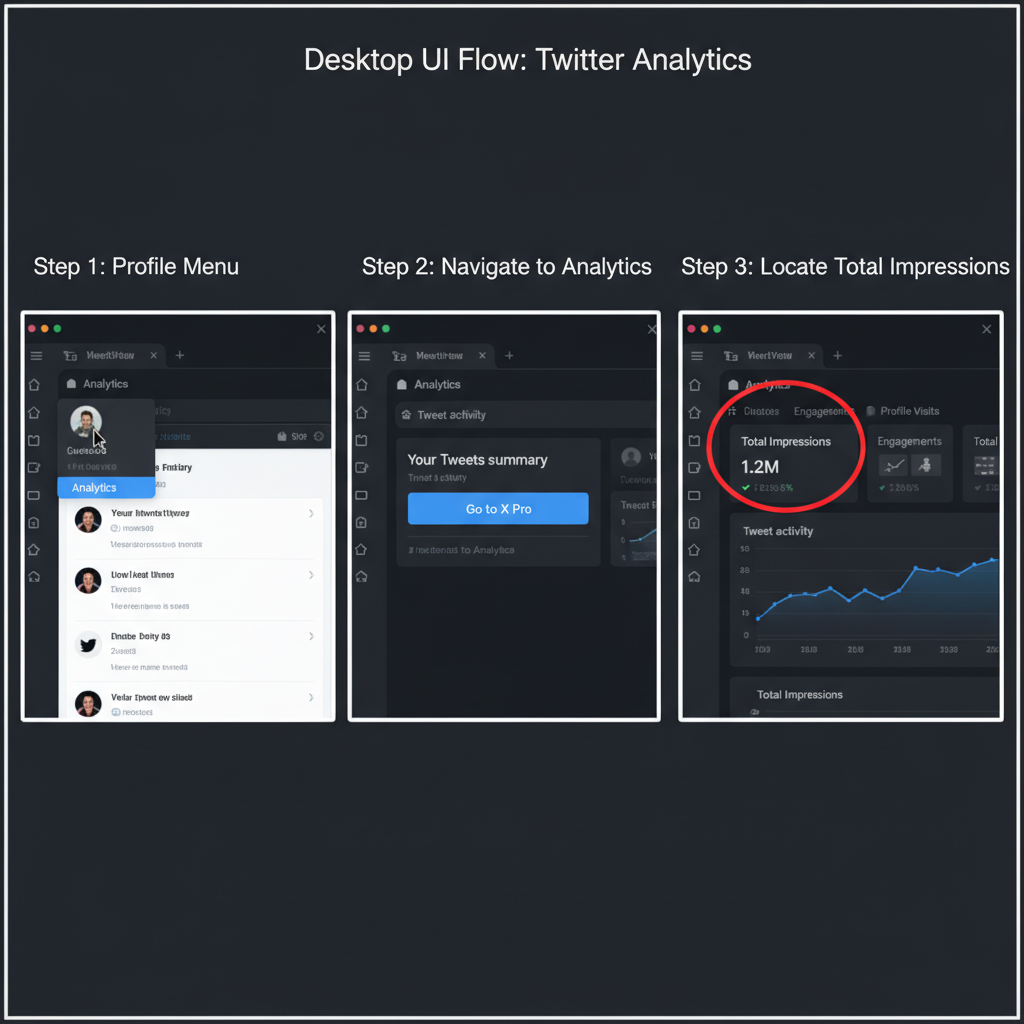
Accessing analytics on desktop is straightforward:
- Log in to your Twitter account via browser.
- Click on the More option in the left navigation menu.
- Select Analytics.
- You’ll land on the Analytics dashboard showing a 28-day summary and monthly highlights.
- Click View all Tweet Activity to see impressions per tweet and your total over a selected period.
---
Access Twitter Analytics via Mobile App
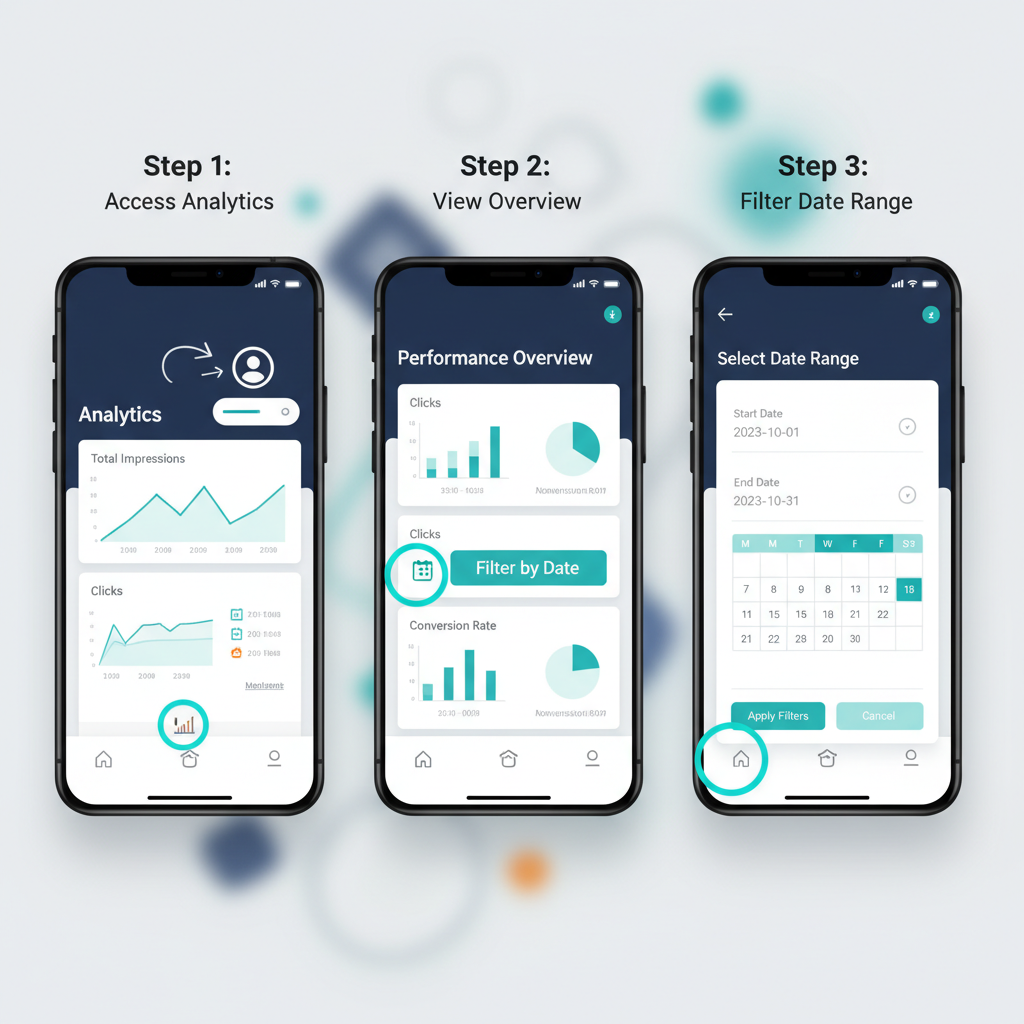
On the mobile app (iOS or Android), you can check impressions even without a dedicated analytics page:
- Open the Twitter app.
- Navigate to the tweet you want to measure.
- Tap the Analytics icon (bar chart) under the tweet.
- A pop-up will show the impressions and other metrics for that tweet.
- For overall metrics, open your profile, tap one of your tweets, then view its analytics.
Note: The mobile app does not currently offer a full dashboard like the desktop version.
---
Viewing Tweet-by-Tweet Impressions and Total Impressions
Within the desktop analytics dashboard, under Tweet Activity, you can view:
- Each tweet’s individual impressions.
- Aggregate impressions over time displayed in graph form.
- Daily impressions as a trend line to spot spikes and dips.
This granular view lets you identify content that draws more visibility and determine when your audience is most active.
---
Filtering Date Ranges
Twitter Analytics lets you filter impressions by date range:
- In Tweet Activity, click the date selector.
- Choose custom date range.
- Select start and end dates to narrow your view.
Filtering by date assists with analyzing data from specific campaign periods, events, or seasonal trends.
---
Exporting Analytics Data to CSV
For deeper insights:
- In Tweet Activity, set the desired date range.
- Click Export data (CSV format).
- Open the CSV file in Excel or Google Sheets.
You can use pivot tables, compare day-to-day performance, and integrate the data with other analytics tools.
---
Interpreting Impression Trends
Understanding trends is key for optimizing visibility:
Factors that increase impressions:
- Posting during peak usage times.
- Using relevant, high-volume hashtags.
- Retweets from influential accounts.
- Including engaging visuals such as images, videos, or GIFs.
Factors that decrease impressions:
- Posting at off-hours.
- Low-quality or repetitive content.
- Limited engagement, leading to less algorithmic distribution.
---
Using Impressions to Refine Tweet Strategy
Your impressions data should guide when and what you post:
- Timing: Schedule tweets when your audience is online, such as midday on weekdays.
- Hashtag Strategy: Research and use trending hashtags that fit your content.
- Content Type: Mix text, images, and videos to maintain interest.
- Frequency: Post consistently but avoid spam.
Test adjustments, measure impressions, and refine accordingly.
---
Common Mistakes When Checking Impressions
Avoid these pitfalls:
- Confusing engagement numbers with impressions.
- Forgetting to set correct date ranges, resulting in incomplete data.
- Overlooking promoted tweet impressions as separate from organic ones.
- Assuming high impressions mean success without considering engagement quality.
---
Privacy & Limitations in Twitter Analytics
Twitter Analytics provides data only for your account. You can’t view impressions for other users’ tweets. Data is also limited in retention — the dashboard may not show lifetime statistics beyond a certain period unless you export CSVs.
Impressions data is anonymized, respecting user privacy by showing counts without revealing specific viewers.
---
Advanced Third-Party Tools
For managing multiple accounts or deeper analysis:
- Hootsuite Analytics – Offers multi-account dashboards and customizable reporting.
- Sprout Social – Delivers extensive cross-network metrics alongside Twitter data.
- Brandwatch – Combines audience analysis with impression tracking features.
These tools can aggregate data, set automated reports, and integrate with CRM systems.
---
Summary: Best Practices for Monitoring Impressions
To maximize your visibility:
- Check impressions weekly to adjust strategy.
- Use date filters for specific campaign analysis.
- Export CSVs regularly to retain historical data.
- Compare impressions against engagement for performance context.
- Tweak posting times and hashtags based on data trends.
By mastering how to check total Twitter impressions, you can make informed, data-driven decisions that consistently improve your tweet reach and grow your audience.
---
Ready to optimize your Twitter presence? Start tracking impressions today, align your posting strategy with insights, and watch your visibility soar.