How to Check Twitter Impressions and Analyze Your Data
Learn how to check Twitter impressions, compare them with reach and engagement, and analyze trends to improve your social media visibility.

How to Check Twitter Impressions and Analyze Your Data
Monitoring your Twitter impressions is crucial if you want to understand how visible your tweets are and fine-tune your social media marketing. In this guide, you’ll learn how to check Twitter impressions, navigate analytics features on both desktop and mobile, compare different types of metrics, and use impression data to improve your organic reach. Whether you’re a social media manager, marketer, or content creator, mastering Twitter Analytics can help boost your visibility and engagement.
---
Understanding Twitter Impressions and Why They Matter
Twitter impressions refer to the number of times a tweet is displayed on someone’s timeline or appears in search results — regardless of whether the user interacts with it.
Key reasons impressions matter:
- They measure visibility rather than engagement.
- High impressions but low engagement may signal a relevance gap.
- Low impressions could indicate reduced reach or poor posting times.
Impressions differ from:
- Reach: the count of unique viewers.
- Engagement: interactions like likes, comments, or retweets.
---
Accessing the Twitter Analytics Dashboard (Desktop Method)
Twitter’s built-in analytics dashboard consolidates impressions, engagement rates, top tweets, and more.
Here’s how to find it:
- Log in to your Twitter account.
- Click your profile icon in the top-right corner.
- Select Analytics from the drop-down menu or go to `https://analytics.twitter.com`.
- View the 28-day summary, including monthly impressions.
Pro Tip: Bookmark the dashboard for faster access, especially if managing multiple accounts.
---
Checking Impressions on Individual Tweets
Desktop Method
- Go to your profile and select the tweet of interest.
- Click View Tweet Activity (bar chart icon).
- Review impressions, clicks, and other engagement metrics.
Mobile Method
- Open the Twitter app and navigate to your profile.
- Tap the chosen tweet.
- Select View Tweet Activity to display the impressions count.
This per-tweet view is invaluable for testing different formats, hashtags, and posting schedules.
---
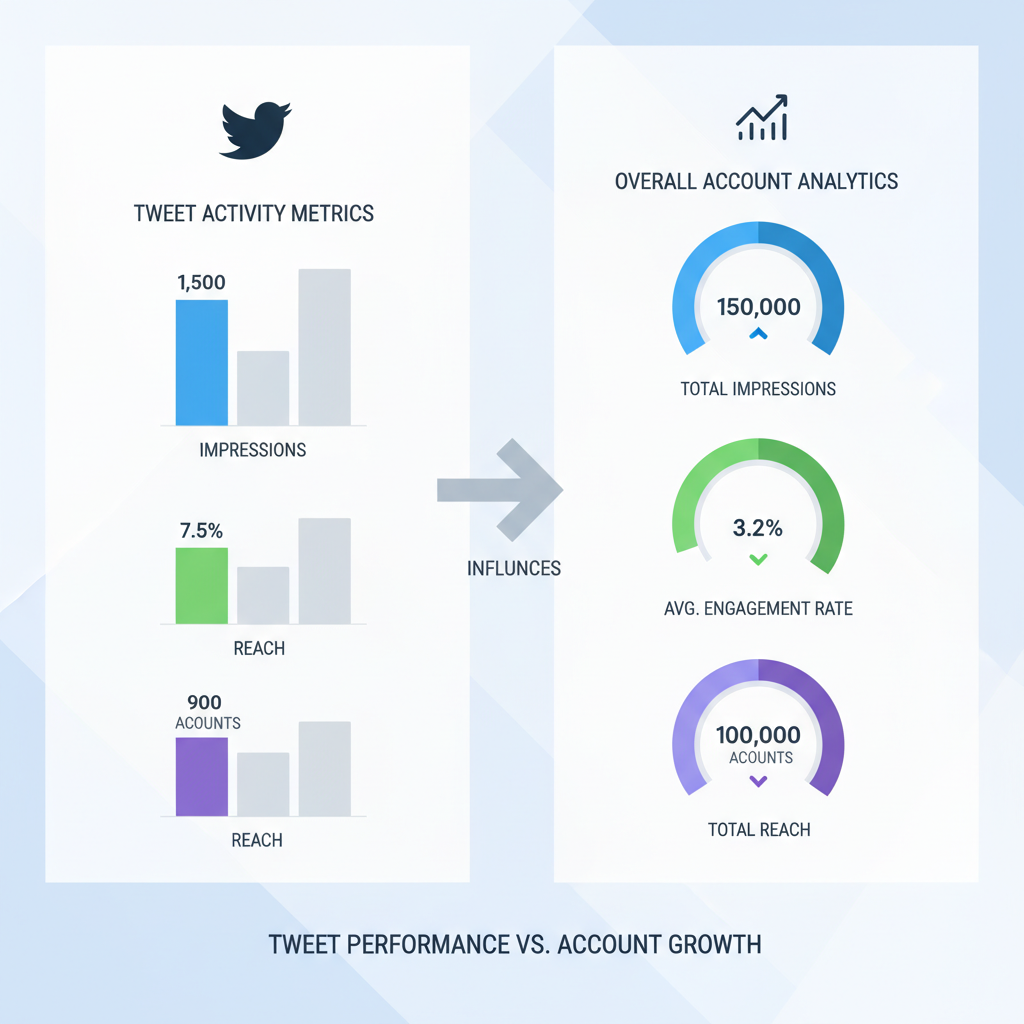
Tweet Activity vs Overall Account Metrics
Within Twitter Analytics, you can view impressions in two ways:
| View Type | Scope | Best Use Cases |
|---|---|---|
| Overall Account Metrics | Total impressions over selected time range | Period-end reports and broad strategy assessment |
| Tweet Activity View | Data for a single tweet | Content testing and experimental formats |
Use overall metrics for long-term trends and per-tweet analytics for immediate content optimization.
---
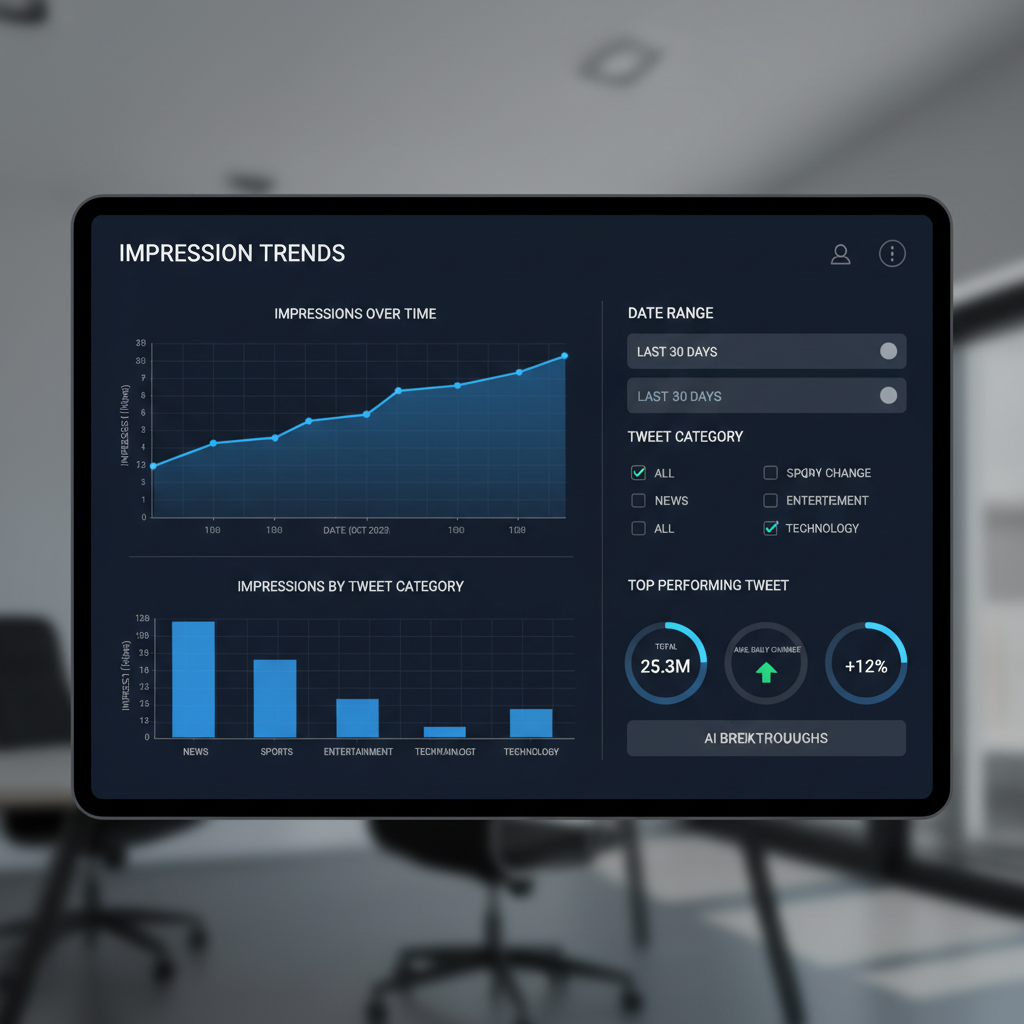
Analyzing Impressions Trends with Charts and Filters
Twitter Analytics displays line chart trends over time. To maximize insights:
- Adjust date ranges to focus on campaigns.
- Investigate spikes — often signs of viral or promoted tweets.
- Explore drops to detect posting gaps or audience decline.
Export CSV data:
- Create custom graphs in spreadsheet tools.
- Filter impressions by hashtags, media type, or tweet length to refine strategy.
---
Distinguishing Impressions, Engagements, and Reach
Don’t confuse the three:
- Impressions: Displays of your tweet (non-unique).
- Engagements: Actions taken by users — retweets, replies, likes, clicks.
- Reach: Unique accounts that saw your tweet.
Clear definitions help avoid skewed reporting and misguided decisions.
---
Exploring Advanced Analytics Tools
Third-party platforms offer enhanced metrics, multi-channel integrations, and flexible reports:
- Hootsuite – Extensive scheduling and performance dashboards.
- Buffer – Simplified reports and post optimization.
- Sprout Social – Audience insights plus content analytics.
- Brandwatch – Social listening with analytics overlays.
Combining Twitter data with other platforms’ metrics gives holistic campaign visibility.
---
Interpreting Impressions to Sharpen Strategy
Use impression trends to:
- Identify high-performing formats (e.g., video vs. photo).
- Determine optimal posting hours.
- Evaluate hashtag performance.
- Cross-reference CTR with impressions to target better.
Patterns will reveal what boosts visibility so you can replicate success.
---
Tips for Increasing Impressions Organically
Five practical steps:
- Post when your audience is most active.
- Choose relevant, trending hashtags.
- Engage in two-way conversations.
- Participate in trending topics.
- Use eye-catching visuals.
Consistency plus strategic tweaks lead to sustained impression growth.
---
Pitfalls in Reading Impression Metrics
Avoid:
- Focusing solely on impressions without engagement context.
- Neglecting rate analysis (impressions vs. engagement percentage).
- Skipping segmentation by campaign or tweet type.
- Drawing conclusions from short timeframes.
Balanced interpretation ensures meaningful KPI tracking.
---
Integrating Impressions into Monthly Reporting
A structured monthly workflow:
- Export your Twitter Analytics data.
- Track month-on-month impression changes.
- Segment by campaign or content type.
- Compare impressions with engagement, follower growth, and conversions.
Example template:
| Metric | Month A | Month B | Change (%) |
|---|---|---|---|
| Total Impressions | 150,000 | 175,000 | +16.7% |
| Engagement Rate | 2.5% | 2.8% | +0.3% |
| Follower Growth | 200 | 250 | +25% |
Regular tracking reveals growth patterns and informs decisions.
---
Summary
Mastering how to check Twitter impressions is key to understanding tweet visibility, fine-tuning posting strategies, and maximizing organic reach. By leveraging both native analytics and advanced tools, segmenting data, and integrating impressions into your reporting cycle, you can make informed changes that boost performance over time. Start monitoring your impressions today to strengthen your content strategy and grow your audience.