Create an Effective Social Media Insights Report
Learn to create a social media insights report by defining objectives, tracking key metrics, segmenting audiences, and using tools for cross-platform analysis.
Create an Effective Social Media Insights Report
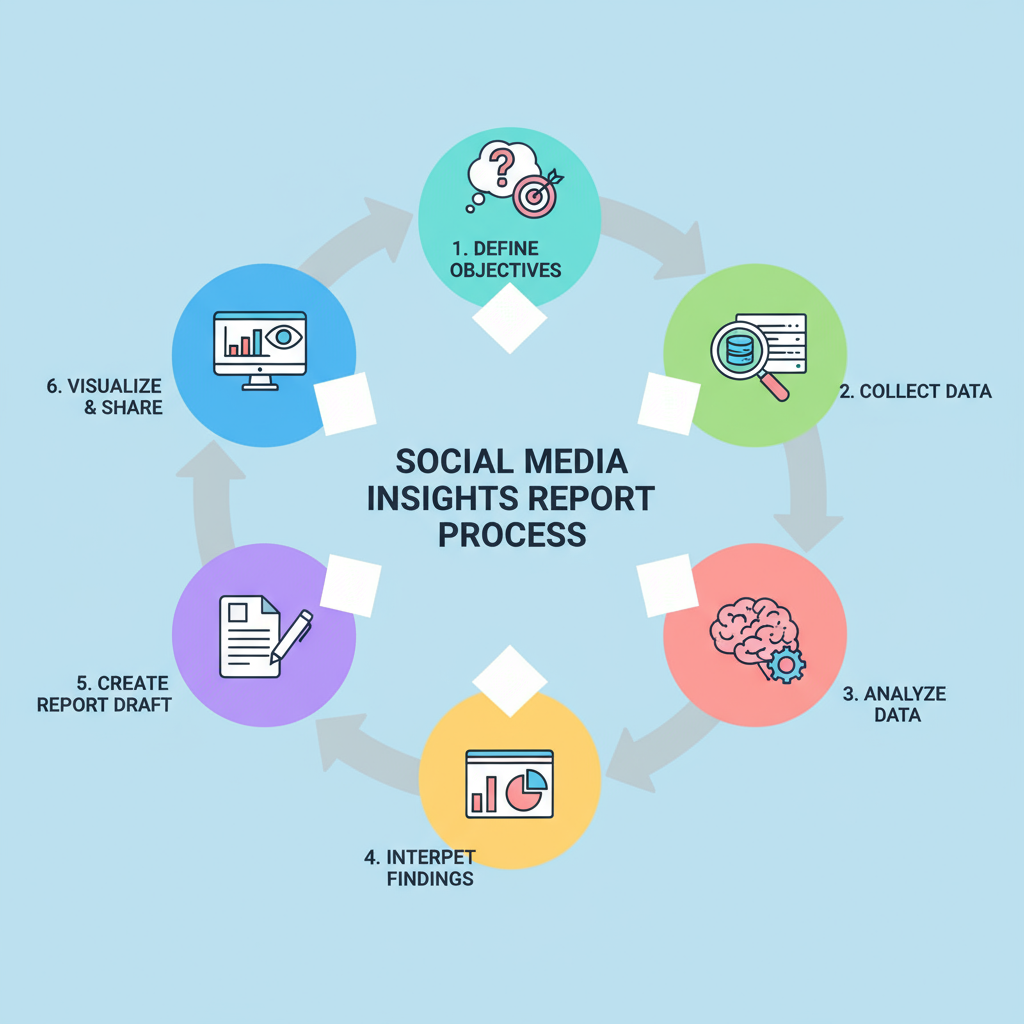
A social media insights report is a powerful tool for tracking the performance of your marketing campaigns, uncovering audience behavior, and guiding future strategy. By systematically gathering, analyzing, and presenting metrics, businesses can refine content, improve engagement, and prove ROI to stakeholders. This guide walks through each step—from defining objectives to archiving reports—so you can build a consistent, data-driven process that maximizes impact.

---
Define Objectives for Your Social Media Insights Report
Before collecting any data, decide what you want your report to achieve. Clear objectives align reporting with overarching business goals and keep it from becoming just a lifeless set of numbers.
Common objectives include:
- Reach: How many users see your content.
- Engagement: Likes, comments, shares, and other audience actions.
- Conversions: Actions that lead directly to sales or lead generation.
Measurable, specific goals create a foundation for meaningful analysis that can inform strategy shifts.
---
Identify Key Platforms and Audience Segments to Analyze
Not all channels need equal attention. Focus your analysis where audience presence and engagement are strongest.
- Key platforms: Facebook, Instagram, Twitter/X, LinkedIn, Pinterest, TikTok.
- Audience segments: Demographic, geographic, psychographic, and behavioral profiles.
Consider breaking your report into separate sections by platform or demographic so stakeholders can quickly locate relevant insights.
---
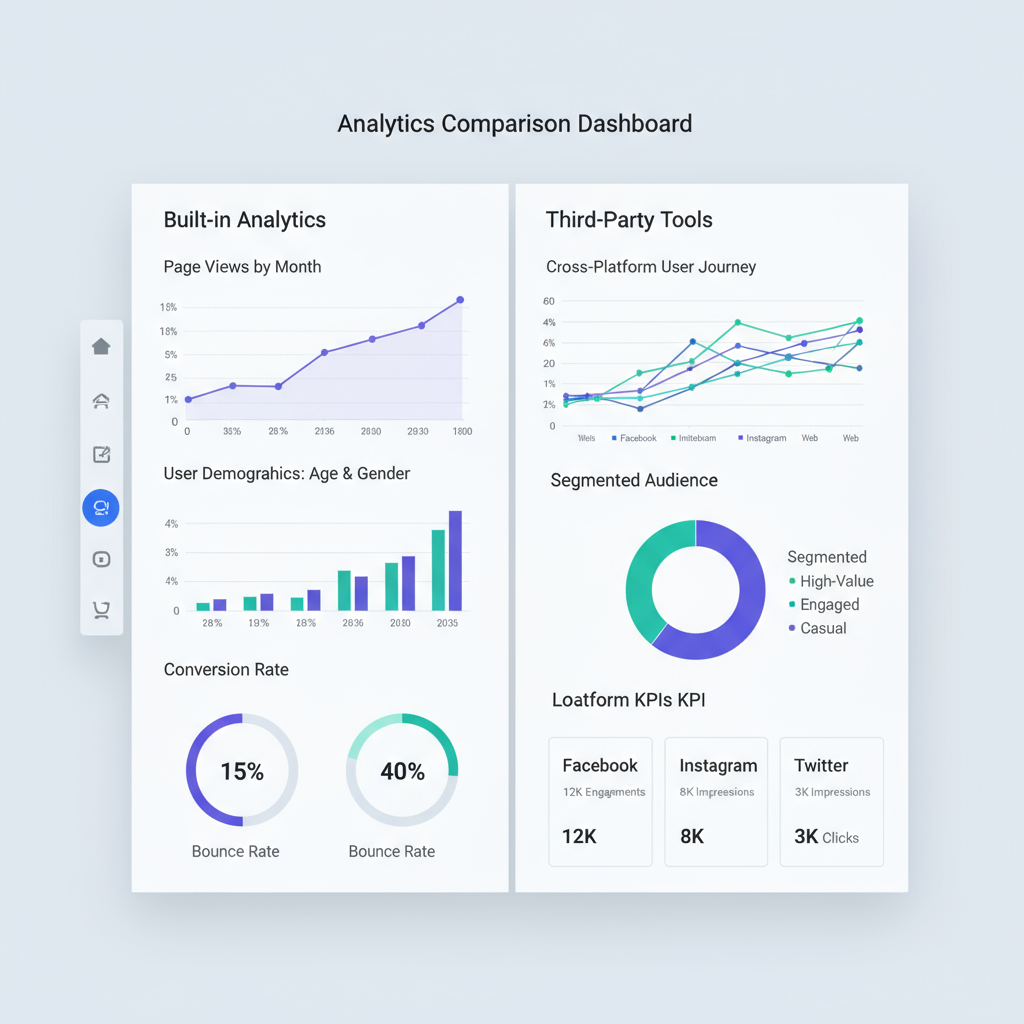
Gather Data from Built-in Analytics Tools
Leverage official analytics dashboards from each platform to ensure authentic, accurate data.
- Facebook Insights
- Instagram Insights
- Twitter Analytics
- LinkedIn Analytics
These dashboards provide real-time and historical figures for reach, impressions, and engagement—critical for comparing different time periods.
---
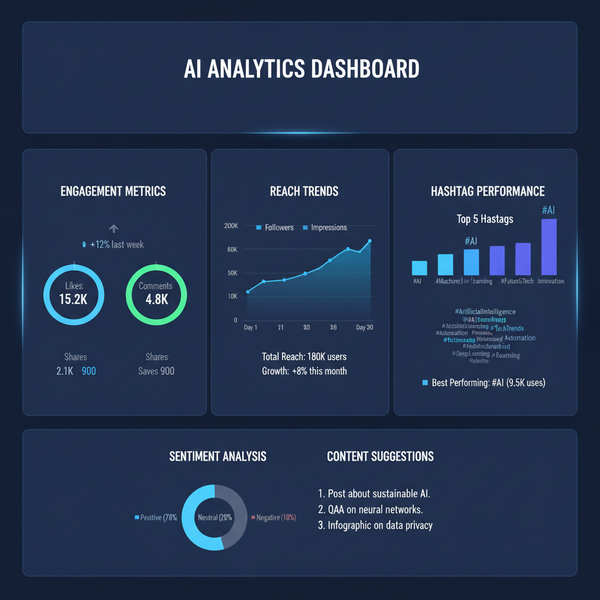
Track Critical Metrics
Identifying and tracking the right metrics ensures your social media insights report tells a complete story.
Essential Metrics
- Followers Growth
- Engagement Rate
- Click-through Rate (CTR)
- Impressions
- Top-performing Content
Example metrics table:
| Metric | Definition | Why It Matters |
|---|---|---|
| Followers Growth | The change in the number of followers over a set time period | Indicates brand interest and potential audience size |
| Engagement Rate | Percentage of audience interacting with your content | Measures content relevance and effectiveness |
| Click-through Rate | Ratio of clicks to impressions | Shows how compelling your calls-to-action are |
| Impressions | Total number of times your content is displayed | Helps quantify reach potential |
| Top-performing Content | Posts generating the highest engagement or conversion | Guides future content planning |
---
Use Third-party Tools for Deeper Cross-platform Analysis
Native analytics are valuable, but third-party tools can connect multiple platforms for consolidated data and deeper insight.
Popular options:
- Sprout Social – robust dashboard, advanced scheduling.
- Hootsuite – multi-platform monitoring and reporting.
- Buffer – straightforward scheduling plus analytics.
- Google Analytics – tracks social referral traffic and conversions.
These tools help teams view performance holistically and reduce manual data gathering.
---
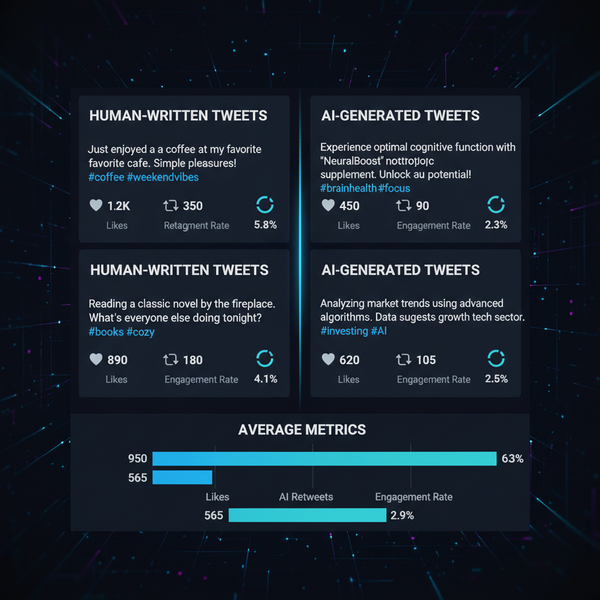
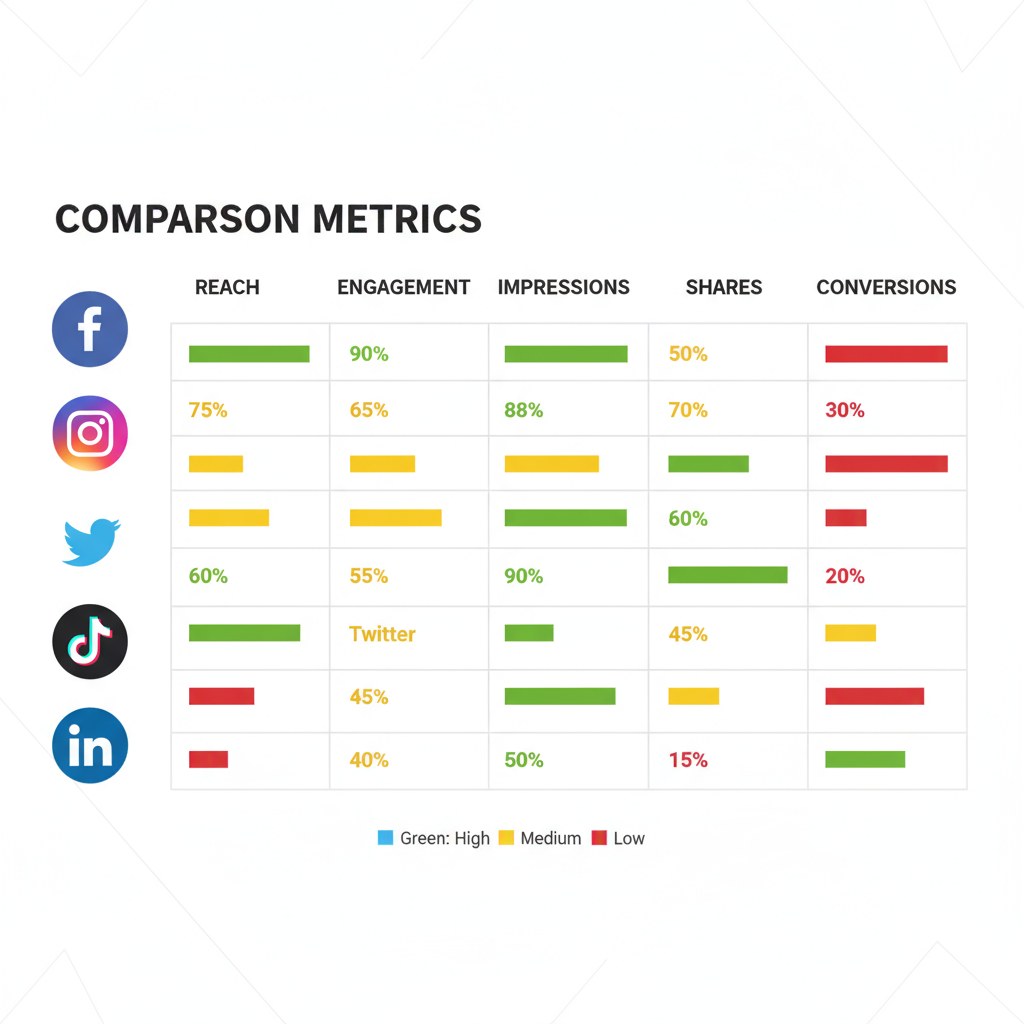
Visualize Data with Clear Charts and Tables
Data visualization makes trends and anomalies obvious at a glance, enhancing the usability of your social media insights report.
Tips:
- Maintain consistent brand-aligned color schemes.
- Clearly label all axes and legends.
- Use concise captions to explain visuals.
Well-crafted visuals boost engagement and comprehension for non-technical stakeholders.
---
Compare Current Performance to Historical Benchmarks
Benchmark comparisons help identify positive trends or areas needing improvement.
Consider tracking:
- Year-over-year monthly reach growth.
- Engagement rate changes after specific campaigns.
- CTR differences pre- and post-creative refresh.
Historical context ensures insights are grounded in real progress metrics.
---
Interpret Insights for Strategic Impact
Raw numbers are not enough—transform them into a narrative.
Ask:
- What drives success? Which formats or topics outperform others?
- Where do we lag? Which platforms show declining engagement?
This interpretive layer helps decision-makers act on the findings.
---
Add Qualitative Context
Combine quantitative data with qualitative feedback to explain the "why" behind performance.
Possible elements:
- Audience feedback from messages or surveys.
- Content themes that resonate.
- Campaign execution notes like timing or creative style.
This dual-view approach makes insights actionable.
---
Draft Recommendations and an Actionable Plan
Turn observations into clear, testable actions:
- Increase video content if video posts consistently outperform.
- Adjust posting times to match peak user activity.
- Refine CTAs to boost click-through rates.
Concrete steps keep momentum moving forward.
---
Design a Clean, Professional Report Layout
An effective social media insights report should guide the reader smoothly through the data.
Best practices:
- Logical order: objectives ➝ data ➝ analysis ➝ recommendations.
- Table of contents for longer documents.
- Balanced text and visuals for readability.
---
Schedule Regular Reporting Intervals
Consistent intervals produce stronger trend detection:
- Weekly: For active short-term campaigns.
- Monthly: For ongoing performance tracking.
- Quarterly: For strategic reviews.
Regularity makes improvement opportunities easier to spot.
---
Ensure Data Accuracy and Transparency
Accuracy builds trust. Clearly document:
- Data sources and any limitations.
- Changes in metric definitions.
- Methodology for calculations.
Transparency minimizes misinterpretation.
---
Distribute and Present the Report Effectively
How you share the report affects its impact:
- Deliver live presentations for collaborative discussion.
- Offer interactive PDFs or dashboards for exploration.
- Share highlights via internal channels to increase visibility.
---
Archive Reports for Long-term Strategic Analysis
Maintain a central archive to:
- Spot multi-year trends.
- Reproduce past successes.
- Avoid repeating past missteps.
Having historical data improves strategic foresight.
---
Summary and Next Steps
A well-crafted social media insights report merges data accuracy, strategic interpretation, and clear formatting. Following this repeatable framework—from setting goals and gathering native analytics, to visualizing and interpreting results—enables better decisions and measurable growth.
Start implementing these steps in your next reporting cycle and refine the process over time for maximum effectiveness. By making reporting a strategic asset, you'll empower your team and strengthen ROI for all social media initiatives.