Design an Engaging Infographic Carousel for Social Media
Learn how to plan, design, and optimize an infographic carousel for social media to boost engagement, retention, and shareability.

How to Create an Engaging Infographic Carousel for Social Media
An infographic carousel is a powerful social media content format that presents information in a swipeable series of slides. By breaking complex data into bite-sized visuals, you can improve engagement, retention, and shareability. This guide walks you through researching, designing, and optimizing your infographic carousel to maximize its impact across platforms.
Understanding the Infographic Carousel and Why It Works
An infographic carousel combines data, icons, concise text, and branded design across multiple slides. Each slide serves a specific purpose, guiding the viewer through a narrative or delivering segmented insights.
Why does it work?
- Higher engagement: Users are encouraged to swipe through, boosting interaction.
- Better retention: Gradual presentation makes information easier to process.
- Shareability: Visually appealing, compact info is more likely to be reposted.
- Storytelling power: Sequential slides mimic a mini-presentation structure.
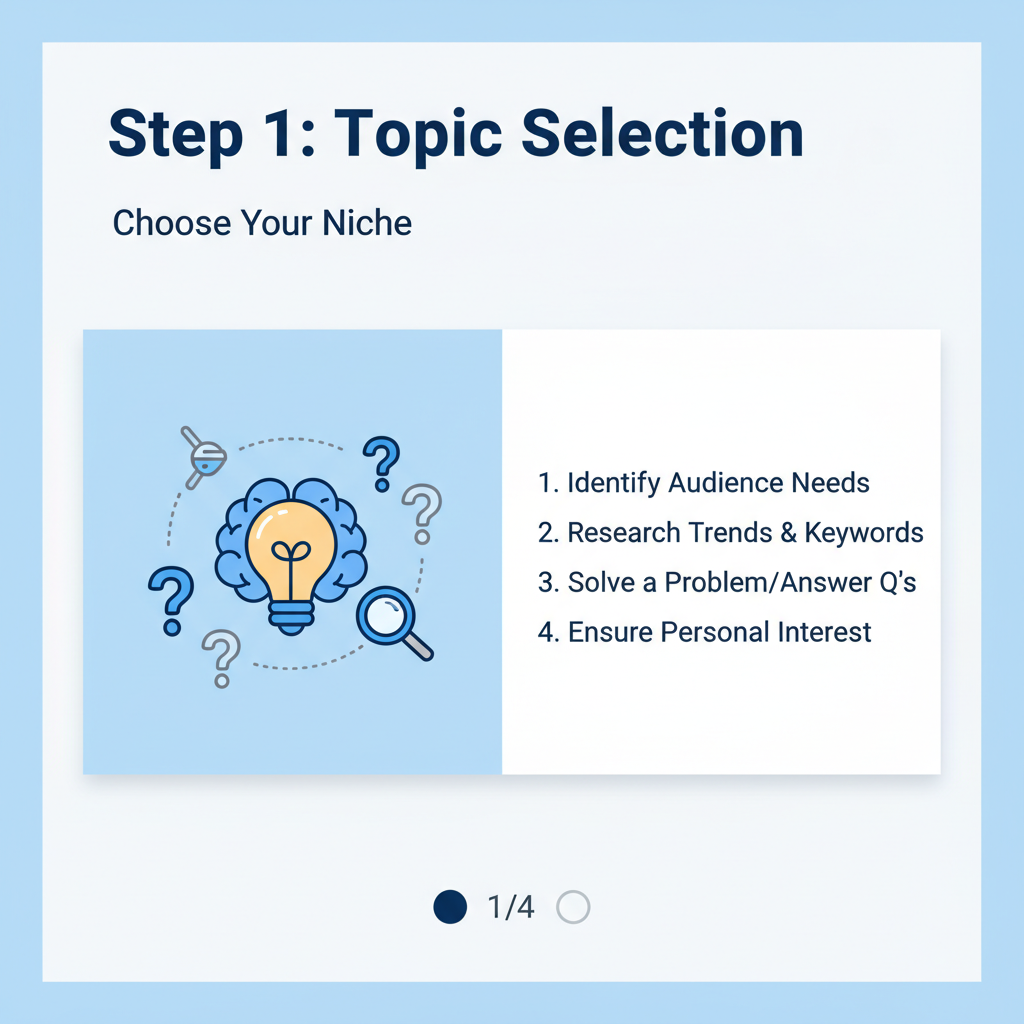
Research and Validate Your Topic
Before designing:
- Identify audience pain points using surveys or polls.
- Monitor trending niches via Google Trends, BuzzSumo, or social listening.
- Review competitor carousels to determine what resonates.
Aligning your topic with relevant audience interests amplifies your infographic carousel’s impact.
Tip: Maintain a spreadsheet that logs ideas, feedback, sources, and key statistics.
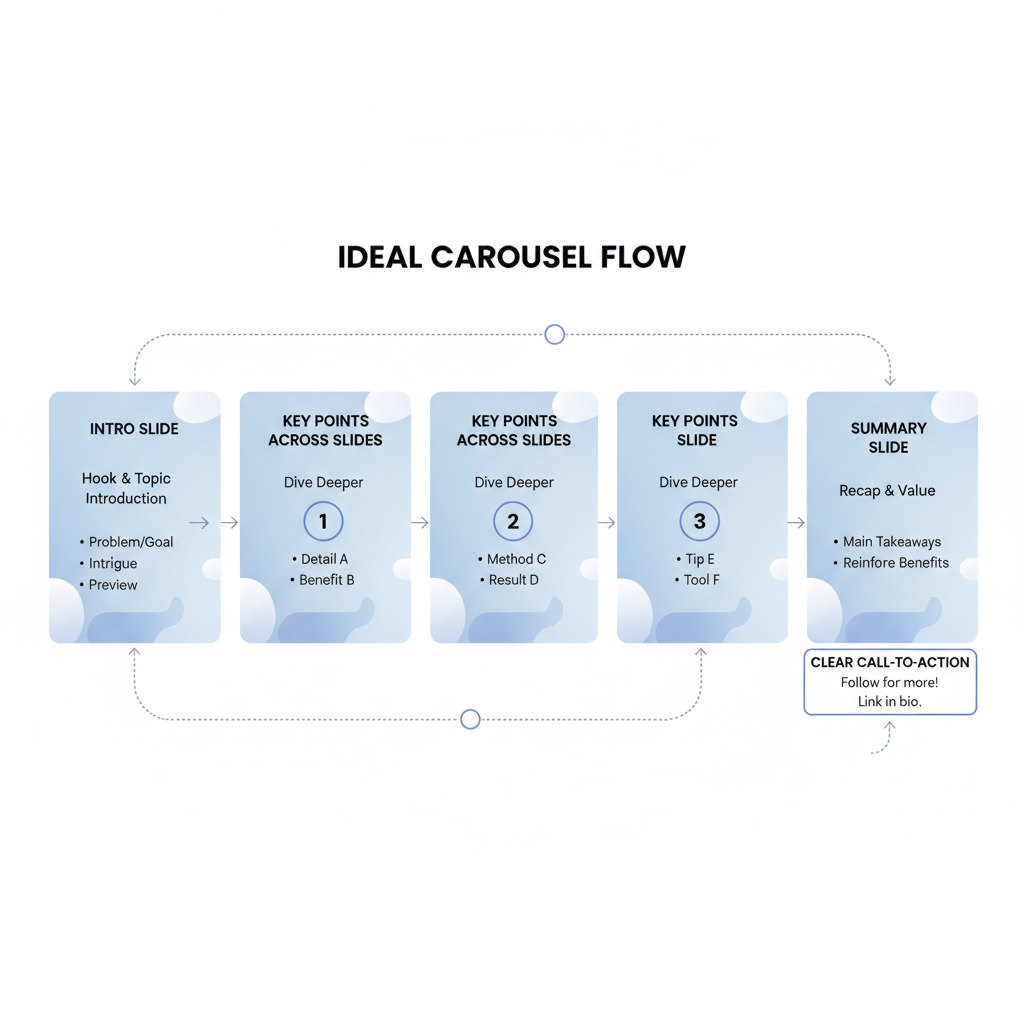
Planning Your Carousel Flow
Planning your slide sequence ensures clarity and engagement.
Ideal Flow
- Intro Slide – Bold question or claim to hook attention.
- Problem Statement – Outline the challenge.
- Solutions – Present actionable tips or insights.
- Examples – Case studies, charts, or diagrams.
- Conclusion/CTA – Prompt further action.
Example Layout Table
| Slide # | Purpose | Content Type |
|---|---|---|
| 1 | Hook | Bold text + brand colors |
| 2 | Problem | Icon + short fact |
| 3 | Solution | Illustrated step-by-step |
| 4 | Example | Chart/Diagram |
| 5 | CTA | Encouragement + next step |
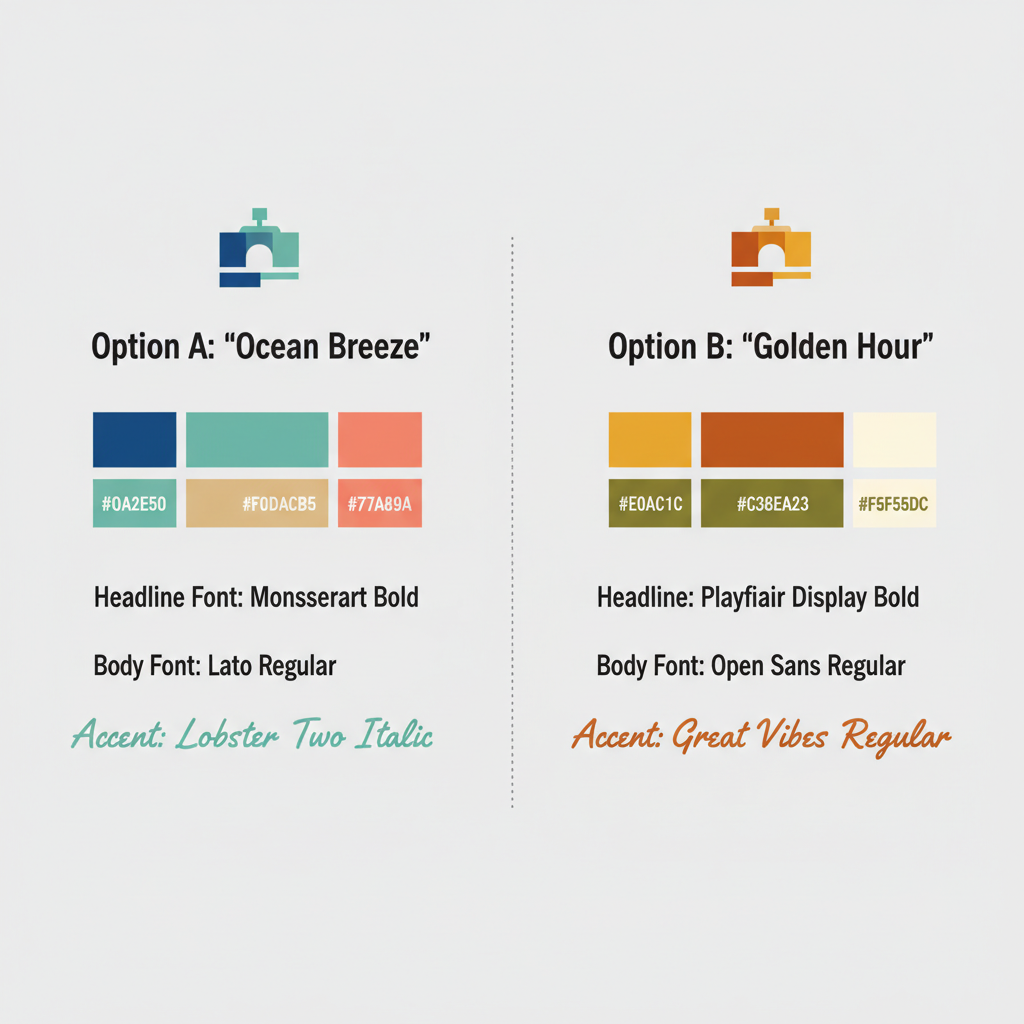
Choosing a Consistent Color Palette and Typography
Maintain strong visual identity:
- Use brand colors throughout.
- Limit to two fonts—one for headings, one for body text.
- Prioritize legibility across all devices.
Consistency helps content stand out and reinforces brand trust.
Simplifying Complex Data Visually
Translate data into accessible visuals:
- Icons for concepts.
- Bar and pie charts for statistics.
- Timelines for chronological information.
- Flow diagrams for processes.
Clarity helps your audience grasp and remember information quickly.
Writing Concise and Powerful Captions
Captions guide viewers through each slide:
- Keep to 10–15 words per slide.
- Employ active verbs and persuasive language.
- Emphasize keywords through bold text or colors.
Example Caption Technique:
Slide: Problem
Caption: "Struggling to convert followers into customers? Here's why..."
Applying Readability Principles
Improve usability with:
- White space to prevent clutter.
- Hierarchy to distinguish headings from body text.
- Alignment for a cohesive appearance.
These principles enhance comprehension and reduce visual fatigue.
Choosing Your Design Tools
Select based on experience and needs:
- Canva – Easy templates for beginners.
- Figma – Precision placement and collaboration.
- Adobe Illustrator – Professional-grade vector graphics.
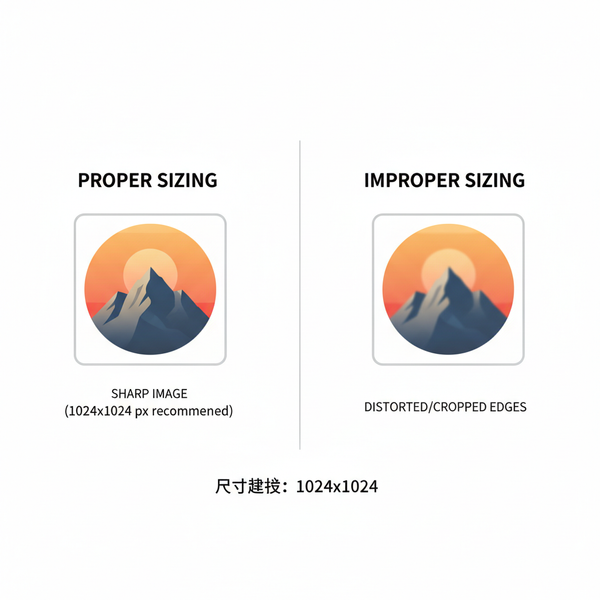
Optimizing for Platform Specs
Different platforms have distinct dimensions:
| Platform | Recommended Carousel Size | Aspect Ratio |
|---|---|---|
| 1080 x 1080 px | 1:1 | |
| 1080 x 1080 px | 1:1 or 4:5 | |
| 1200 x 628 px | 1.91:1 |
Export at high resolution to maintain clarity.
Adding Accessibility Features
Make your carousel inclusive:
- Provide alt text for each slide.
- Maintain high contrast between text and background.
- Select fonts that are mobile-friendly.
Strong Hooks and CTAs
Your intro slide should grab attention with a provocative question or statistic.
Your final slide should direct action clearly:
- “Follow for more insights”
- “Download our free guide”
- “Join our upcoming webinar”
Compressing Images for Fast Loading
Prevent slow load times:
- Use compression tools like TinyPNG, Squoosh, or ImageOptim.
- Balance file size and image clarity.
Preview, Test, and Refine
Before posting:
- Check mobile and desktop display.
- Verify readability and layout.
- Request peer feedback.
Scheduling for Peak Activity
Post during high-traffic periods for your audience:
- Analyze platform insights.
- Utilize tools such as Buffer, Later, or Hootsuite.
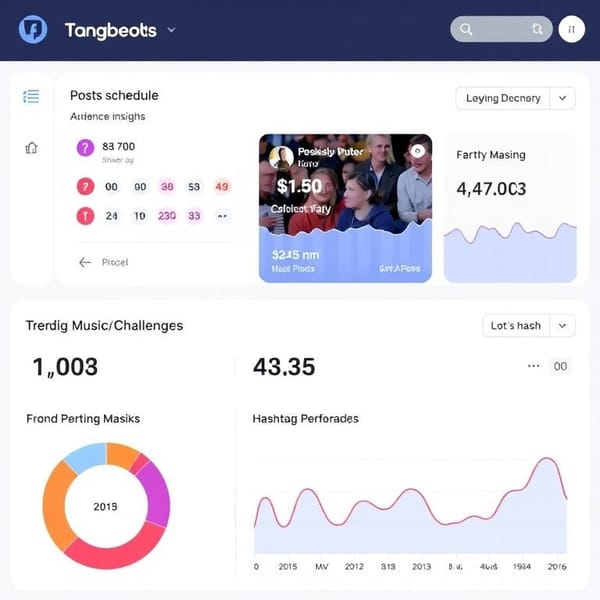
Monitoring Analytics and Iterating
Track metrics post-launch:
- Views
- Swipe-through rate
- Saves
- Shares
Identify top-performing slides and refine future content accordingly.
---
Summary:
An infographic carousel delivers complex content in a visually appealing, swipeable format that boosts engagement on social media. By researching your topic, planning your slide sequence, designing for readability, and optimizing for each platform, you can increase visibility and interaction.
Call to Action: Start creating your next infographic carousel today—apply these tips, track your results, and watch your social media engagement grow.