Create an Effective Social Media Performance Report
Learn how to create a data-driven social media performance report with clear goals, KPIs, audience insights, and actionable content analysis.

How to Create an Effective Social Media Performance Report
An effective social media performance report is the backbone of data‑driven marketing. It enables teams to assess the impact of campaigns, refine content strategies, and communicate measurable results to decision‑makers clearly and persuasively. In this comprehensive guide, you'll learn how to set goals, choose KPIs, gather and analyze data, visualize insights, and recommend actions so your report becomes a strategic tool for growth.
---
Define Clear Goals and KPIs
Every performance report begins with a specific purpose. Identify what you want to measure based on business objectives and marketing strategies.
Examples of Goals
- Increase brand awareness
- Drive website traffic
- Generate qualified leads
- Boost engagement and community interaction
From these goals, define key performance indicators (KPIs) such as:
- Reach
- Impressions
- Engagement rate
- Follower growth
- Click‑through rate (CTR)
Clear goals and KPIs keep your report focused on relevant metrics, eliminating unnecessary data noise.
---
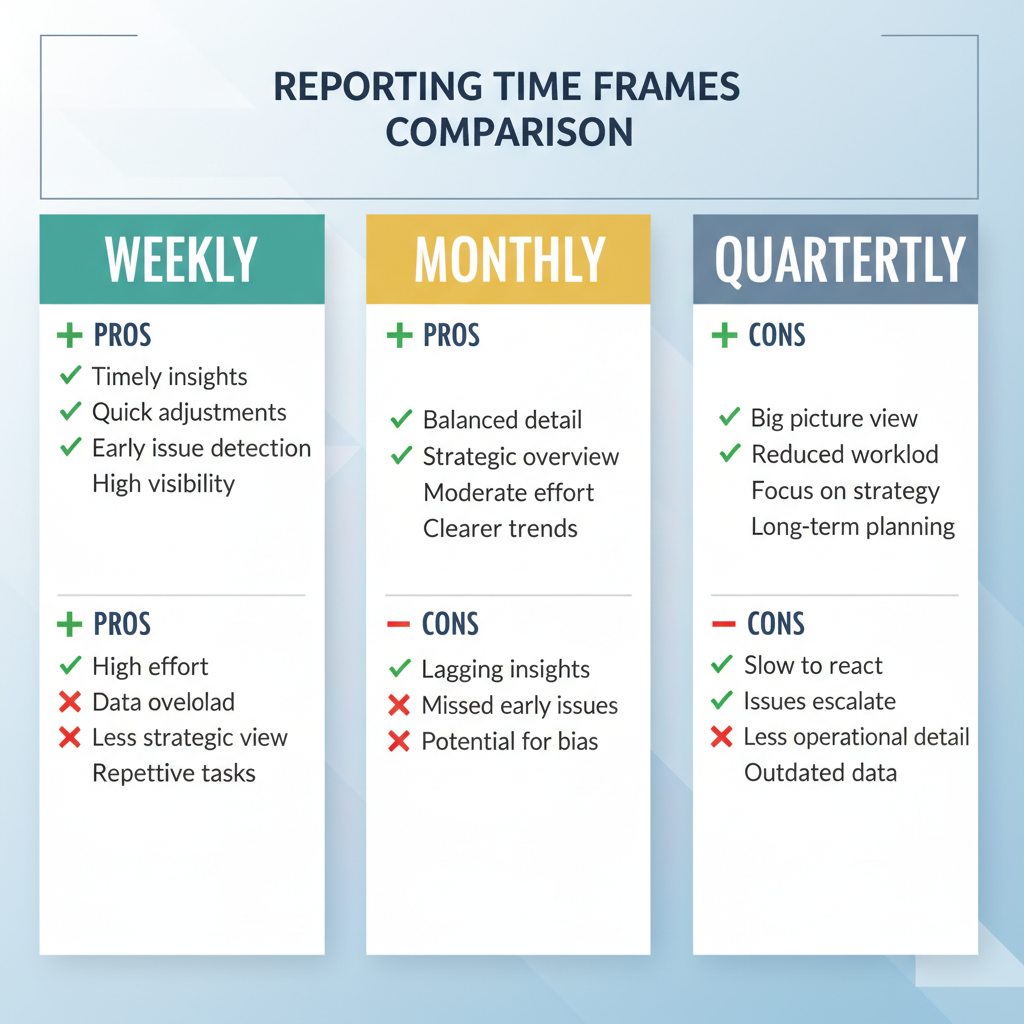
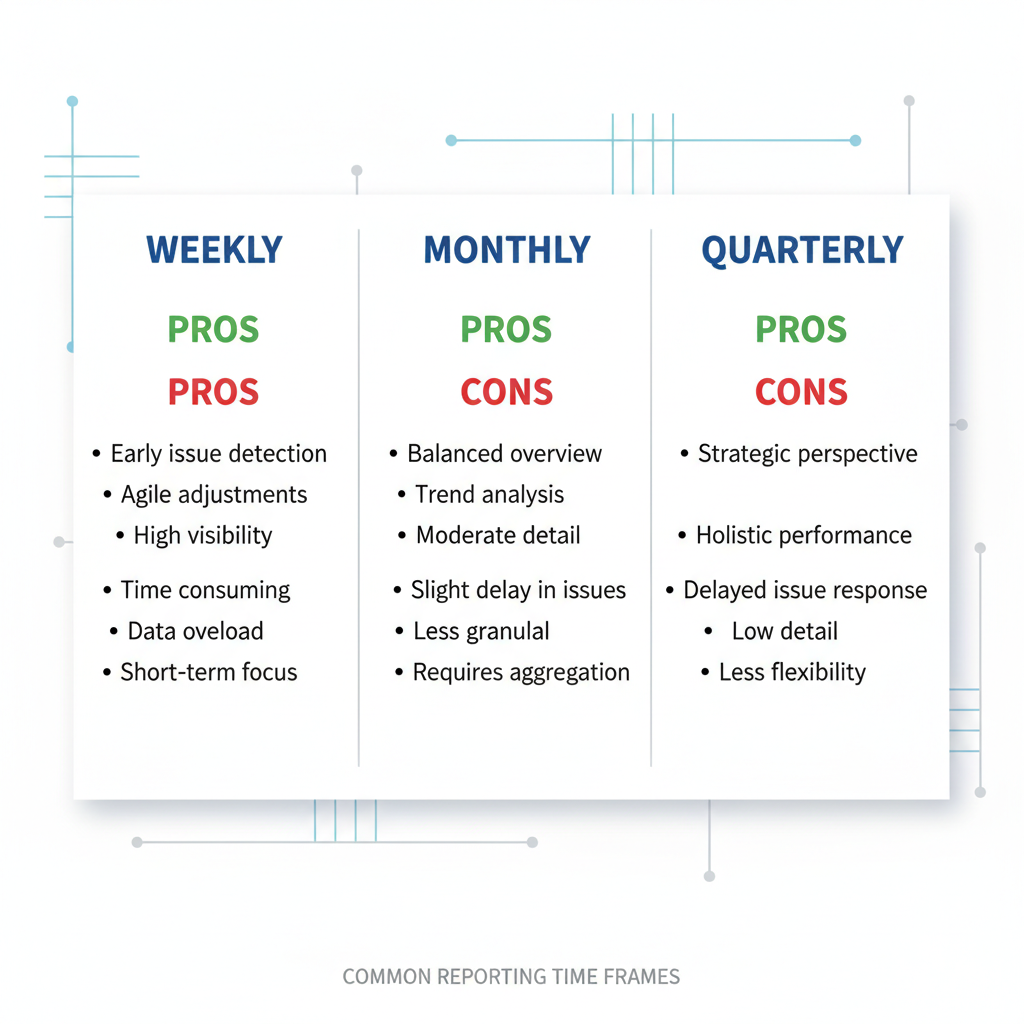
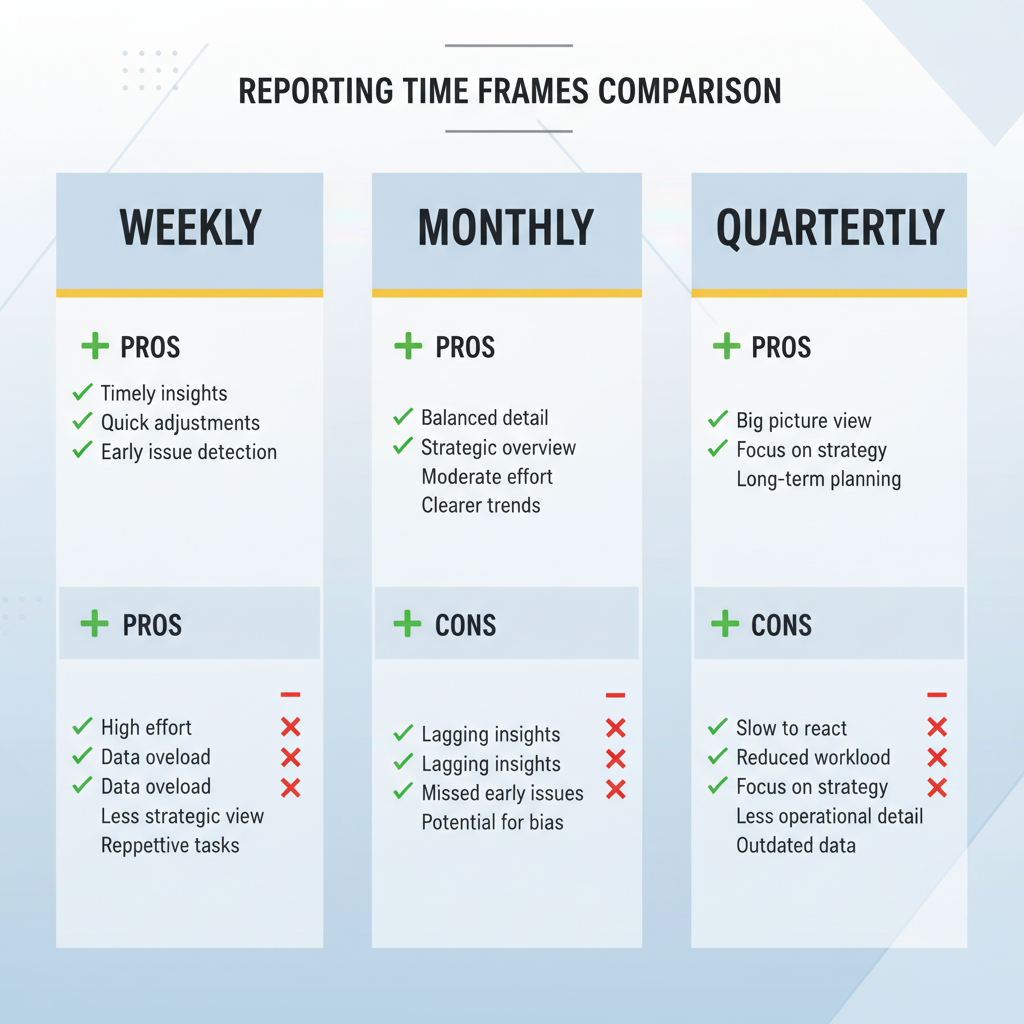
Choose a Consistent Reporting Time Frame
Consistency is crucial for identifying trends and comparing results over time.
Common Time Frames
- Weekly – ideal for quick campaign adjustments
- Monthly – suitable for in‑depth tactical reviews
- Quarterly – best for strategic evaluations
By maintaining the same period for each report, patterns become easier to spot and data‑driven decisions more reliable.
---
Gather Data from Native Analytics Tools
Leverage the analytics dashboards provided by each major social media platform:
- Facebook Insights – reach, impressions, post engagement
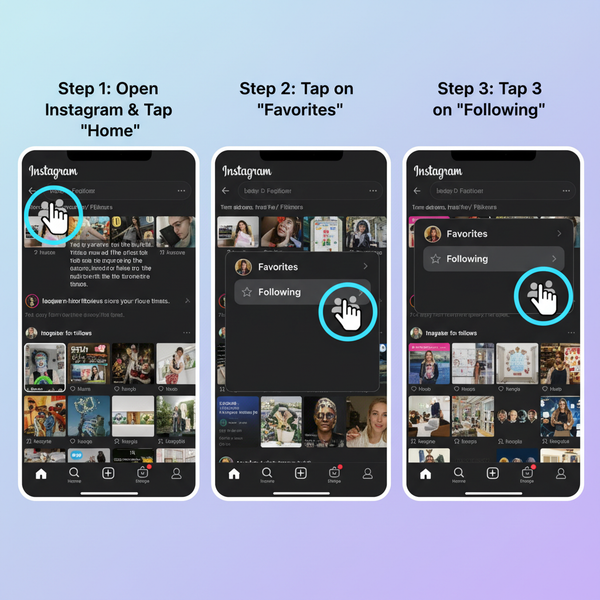
- Instagram Insights – profile visits, story reach, content interactions
- Twitter Analytics – tweet impressions, engagement rates
- LinkedIn Analytics – post views, clicks, audience demographics
Collecting data from multiple native sources ensures a comprehensive overview of your social media performance.
---
Include Core Metrics
Your report should highlight the most impactful metrics based on the defined goals.
| Metric | Definition | Why It Matters |
|---|---|---|
| Reach | Number of unique users who saw your content | Shows audience size and potential exposure |
| Impressions | Total times your content was displayed | Indicates content frequency and visibility |
| Engagement Rate | (Engagements ÷ Impressions) × 100 | Measures content quality and audience interaction |
| Follower Growth | Change in follower count during the chosen period | Reflects brand appeal and organic reach potential |
| Click‑Through Rate | (Clicks ÷ Impressions) × 100 | Indicates link effectiveness and conversion potential |
---
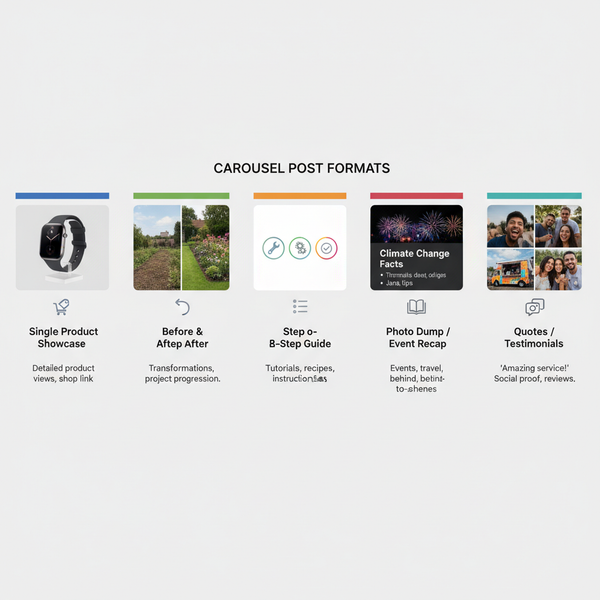
Analyze Top‑Performing Posts and Content Types
Identify which posts generated the highest engagement, clicks, or conversions. Segment results by content format:
- Photo posts
- Videos
- Stories or ephemeral content
- Carousel posts
- Live streams
This will reveal what your audience responds to best, guiding your future content strategies.
---
Identify Audience Demographics and Peak Activity Times
Understanding your audience demographics strengthens targeting and scheduling decisions. Record insights on:
- Age ranges
- Gender distribution
- Geographic locations
- Online activity patterns
Highlight peak posting times to ensure publishing aligns with audience behavior, maximizing reach and engagement.
---
Visualize Data for Easier Insights
Charts and graphs communicate data quickly and clearly. Consider:
- Line charts for follower growth over time
- Bar charts for engagement per post
- Pie charts for demographic breakdown
Visual elements in a social media performance report help stakeholders grasp trends more efficiently than raw numbers alone.
---
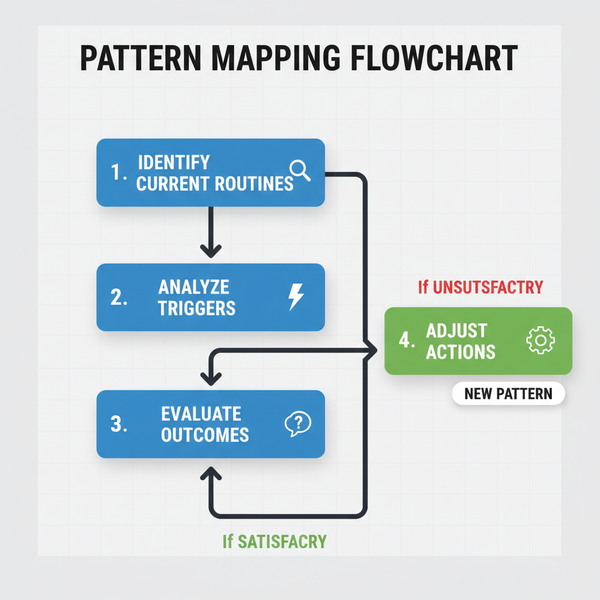
Interpret Trends and Patterns
Go beyond metrics by identifying the implications of your data:
- Seasonal engagement peaks
- Drops in reach following algorithm updates
- Content fatigue from repetitive formats
Recognizing these patterns allows you to propose strategies for improvement.
---
Compare Current vs Previous Period and Benchmarks
Provide valuable context by:
- Showing period‑over‑period changes to identify growth or decline
- Comparing with industry benchmarks to assess competitiveness
Such comparisons answer whether performance is genuinely improving or lagging.
---
Highlight Actionable Recommendations
Data should lead to decisions. Potential recommendations include:
- Increase video content if engagement shows higher response rates
- Schedule posts during identified high‑traffic times
- Optimize captions and hashtags based on engagement analysis
Actionable steps make your social media performance report a driver of change rather than a static recap.
---
Include Notes on Algorithm Changes and External Factors
Performance fluctuations may be influenced by:
- Algorithm updates
- Seasonal events or holidays
- Industry news cycles
- Competitor campaigns
Documenting these helps explain anomalies and prepares teams for future impacts.
---
Tailor Report Format for Stakeholders
Adjust information depth according to your audience:
- Executives – high‑level KPIs, concise visuals
- Marketing team – in‑depth analysis and tactical insights
- Clients – ROI‑focused data, brand growth metrics
Customized formats improve clarity and make the report more relevant.
---
Ensure Data Accuracy and Consistency
Credibility depends on accuracy:
- Double‑check analytics exports
- Use consistent formulas
- Standardize definitions across channels
This supports reliable tracking over time.
---
Automate Repetitive Data Collection
Leverage automation tools to save time:
- Google Data Studio
- Power BI
- Hootsuite Analytics
- Sprout Social
Example Python automation using Twitter API:
import requests

## Fetch Twitter tweet metrics

url = "https://api.twitter.com/2/tweets"
headers = {"Authorization": "Bearer YOUR_ACCESS_TOKEN"}
params = {"ids": "1234567890", "tweet.fields": "public_metrics"}

response = requests.get(url, headers=headers, params=params)
data = response.json()
print(data)
Automation streamlines processes and frees resources for deeper analysis.
---
Key Takeaways
Creating an effective social media performance report involves:
- Setting clear goals and KPIs
- Using consistent reporting periods
- Pulling accurate data from native analytics tools
- Analyzing top content and audience behavior
- Visualizing metrics for improved understanding
- Interpreting trends with context
- Delivering actionable recommendations
- Tailoring format for stakeholders
- Automating repetitive tasks
By following this guide, you can deliver reports that not only inform but actively shape social media strategies. Start applying these principles today to enhance your campaigns, engage stakeholders, and drive measurable results.