How to Analyze a Twitter Follower Chart for Growth
Learn how to read and interpret Twitter follower charts to track growth trends, link engagement to results, and refine your social media strategy.

How to Analyze a Twitter Follower Chart for Growth
Understanding your Twitter follower chart is essential for tracking audience growth and engagement trends over time. Whether you’re a marketer, creator, or brand, knowing how to interpret this data empowers you to refine content strategy, target the right audiences, and maximize return on your social media activities. This guide will walk you through what follower charts show, how to interpret them, and how to apply insights for sustainable Twitter growth.

---
What Is a Twitter Follower Chart and Why It Matters
A Twitter follower chart is a visual representation showing how your follower count changes over a specific period. It helps highlight fluctuations, reveal growth trends, and link social activities to audience impact.
Follower charts matter because:
- They expose periods of rapid growth or follower loss.
- They correlate tweets, campaigns, and engagement with results.
- They help set realistic growth and engagement goals.
- They provide data for ROI measurement and stakeholder reporting.
---
Key Metrics Shown on Follower Charts
Twitter follower charts typically display several valuable metrics:
Daily Change
Displays the number of followers gained or lost each day.
A sharp increase may indicate viral content or a well-executed campaign.
Total Count
Shows the cumulative number of followers over time.
This presents the overall growth trajectory and long-term performance.
Engagement Correlation
Some charts include secondary metrics such as retweets, likes, or mentions plotted against follower changes.
This helps identify whether engagement directly drives audience growth.
---
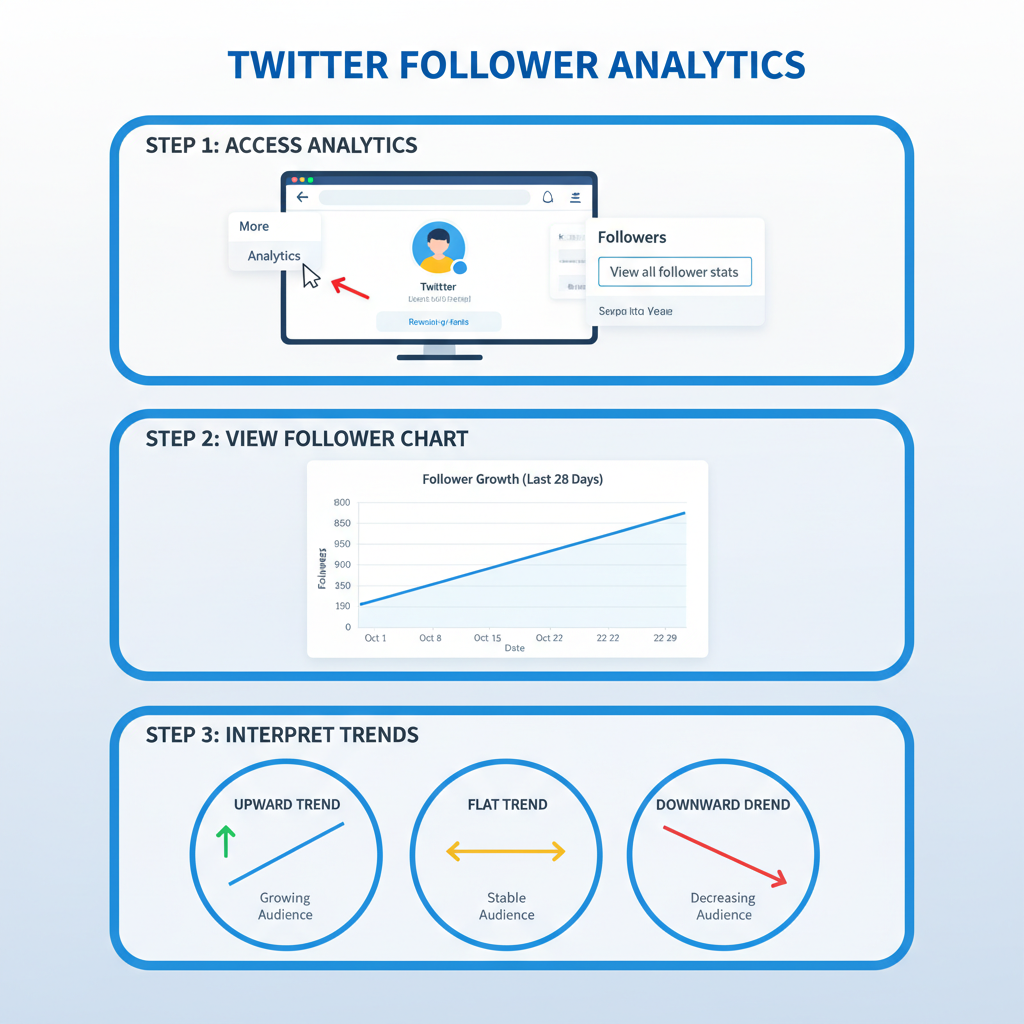
How to Access a Twitter Follower Chart
You can access follower chart data through two main sources:
- Native Twitter Analytics
- Found in your account dashboard under `Analytics > Followers`, offering a straightforward visual of follower trends.
- Third-Party Tools
- Platforms like Sprout Social, Hootsuite, or Followerwonk provide deeper analysis with filters, segmentation, and data export options.
---
Step-by-Step Guide to Interpreting Trends
Follow these steps for effective analysis:
- Choose a consistent timeframe – Compare data month-over-month or year-over-year.
- Spot growth patterns – Identify consistent inclines, flat periods, or declines.
- Mark notable events – Annotate product launches, media features, conferences, or PR incidents.
- Measure rate of change – Calculate average daily or weekly growth rates.
- Cross-reference engagement data – See if spikes align with high-engagement posts.
---
Recognizing Seasonal or Event-Based Spikes
Many profiles have predictable growth cycles:
- Seasonal impacts — e.g., tourism accounts peak in summer.
- Event-driven spikes — growth during major campaigns, product launches, or conferences.
- News-related surges — follower increases tied to trending industry topics.
If you spot recurring spikes, prepare targeted campaigns to maximize those opportunities.
---
Using Follower Chart Insights to Shape Content Strategy
Chart data can show which content types resonate most:
- Engagement and follower increases after educational threads → create more how-to posts.
- Drop in followers after divisive tweets → reassess tone and themes.
By connecting chart changes with content types, you can strategically adjust your posting for better results.
---
Tracking Correlations Between Tweets, Campaigns, and Growth
Identifying which campaigns deliver the biggest returns is easier when you visualize data:
| Date Range | Event/Content | Follower Change | Engagement Rate (%) |
|---|---|---|---|
| Jan 3–Jan 10 | Product Launch Thread | +1,250 | 6.5 |
| Feb 14–Feb 15 | Viral Meme | +2,100 | 9.3 |
| Mar 8–Mar 12 | Industry Report Release | +1,800 | 7.4 |
Maintaining such records enables data-backed decision-making.
---
Benchmarking Against Industry Growth Standards
Compare your chart against relevant industry averages:
- Use benchmarking reports from tools like Sprout Social or Rival IQ.
- If growth lags behind competitors, investigate improvements in content quality, posting consistency, and engagement tactics.
Benchmarking keeps you competitive and goal-oriented.
---
Setting Realistic and Achievable Growth Goals
Using your follower chart data:
- Find your average monthly growth rate.
- Establish incremental improvement goals (e.g., +5% per month).
- Adjust for seasonal or cyclical factors.
Realistic benchmarks sustain performance without overextending resources.
---
Avoiding the Vanity Metric Trap
A growing follower count means little without active engagement:
- Track comments, shares, and conversations alongside numbers.
- Monitor engagement rate trends and cross-compare with follower changes.
- Clean up inactive or spam accounts periodically.
A fuller analysis combines audience size with audience activity.
---
Creating Consistent Reporting Routines
Regular reporting ensures timely decisions:
- Export CSV files from analytics software monthly or quarterly.
- Build comparative slide decks for leadership or clients.
- Capture wins, challenges, and next steps to inform each new cycle.

---
Common Follower Chart Analysis Mistakes
Avoid these pitfalls:
- Short-term obsession — Overreacting to one-day changes.
- Ignoring context — Not factoring in campaigns or major events.
- Misattributing causes — Assuming drops are due to content without verifying timing.
Always examine multiple data sources for accuracy.
---
Integrating Insights Into Broader Marketing Strategy
Follower chart analysis should influence:
- Editorial/content calendars.
- Paid ad budget allocation.
- Cross-platform marketing efforts.
Link Twitter insights with wider marketing to create consistent audience growth.
---
Recommended Tools and Dashboards
To maintain reliable tracking, explore:
- Twitter Analytics – Easy, free starter option.
- Followerwonk – Specialized audience and follower analysis.
- Hootsuite/Sprout Social – Integrated dashboards with scheduling and reporting tools.
- Google Data Studio – Build custom visualizations via APIs.
---
Final Tips for Long-Term Twitter Growth
- Think of your follower chart as a tool for diagnosis and improvement, not just ego.
- Combine hard numbers with qualitative cues, like sentiment in replies.
- Prepare for and capitalize on seasonal or news-driven surges.
- Keep your content valuable, relevant, and consistent.
By carefully interpreting and applying the insights from your Twitter follower chart, you’ll transform raw numbers into actionable strategies that drive sustained, meaningful growth.
---
Summary:
Analyzing a Twitter follower chart helps you spot growth trends, identify high-performing content, benchmark your progress, and set achievable goals. With consistent reporting and a focus on engagement, you can turn data into decisions that amplify your Twitter success.
Ready to grow? Start tracking your follower trends today and optimize your strategy for maximum impact.