How to Analyze a Facebook Insights Report for Marketing Succ
Learn how to analyze Facebook Insights reports to track metrics, understand audience behavior, and refine your content strategy for better engagement.

Introduction to Facebook Insights Reports for Marketers
Facebook is still one of the most effective platforms for brands to reach, engage, and grow their communities. The Facebook Insights report is a detailed analytics tool that reveals exactly how your page and content are performing. Understanding it enables you to make data-driven decisions, refine your campaigns, and maximize ROI.
By analyzing trends in the report, marketers can uncover audience preferences, identify best-performing content, and adjust strategy for maximum impact. Whether you run a small business, manage a client page, or lead an enterprise social team, mastering Facebook Insights will help you grow your presence more efficiently.
---
How to Access the Facebook Insights Dashboard
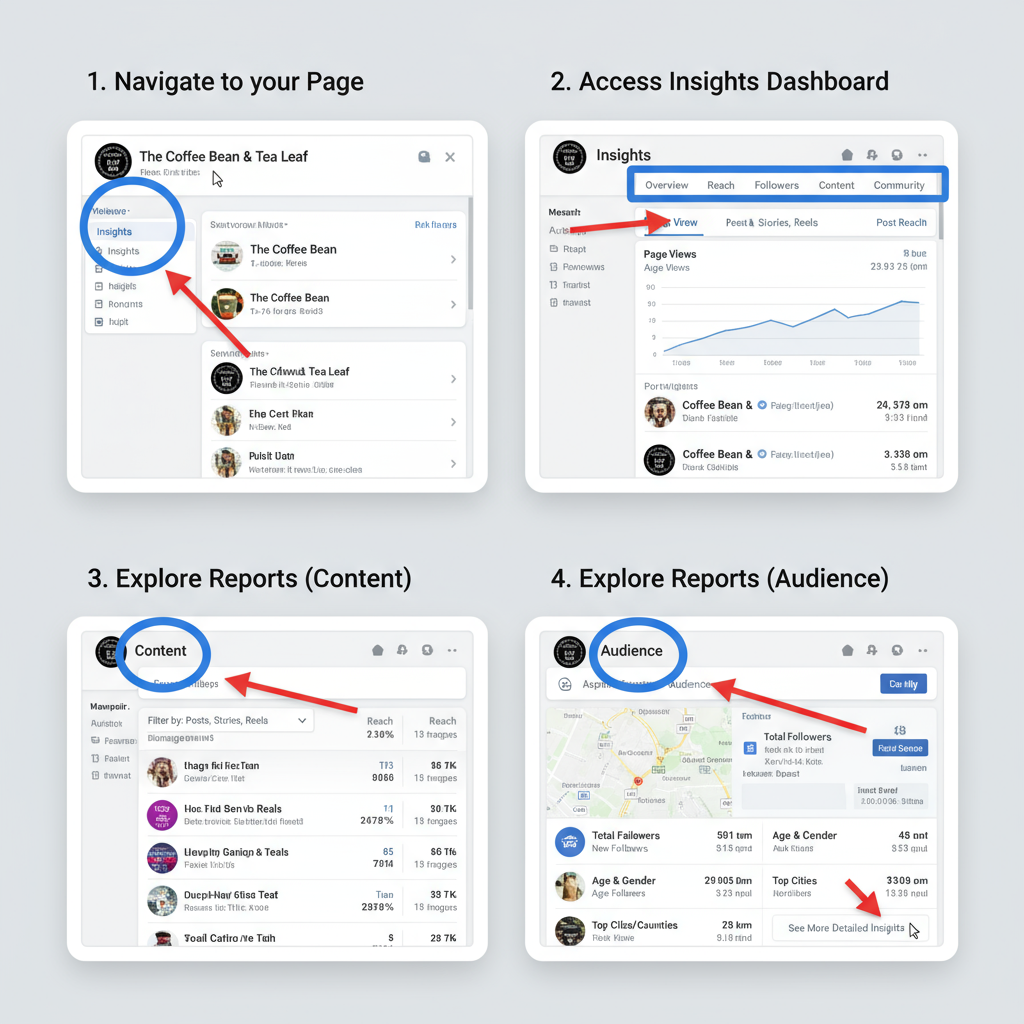
Accessing your Facebook Insights dashboard is simple:
- Navigate to Your Page – Log in to Facebook and switch to the page you manage.
- Click on “Insights” – Find the "Insights" tab in the left-hand navigation menu.
- Choose the Timeframe – Apply filters at the top right to analyze custom date ranges.
Once inside, the dashboard offers an overview for a quick health check and deeper analytic modules for specific metrics.
---
Overview of Key Facebook Insights Metrics
Before you can draw meaningful conclusions, you need to understand the main terms used in your Facebook Insights report.
Reach
The total number of unique people who saw your content at least once. This is your visibility measure.
Engagement
Sum of all actions people take on your content—likes, comments, shares, and clicks.
Impressions
The total number of times your content was displayed, even if the same person saw it multiple times.
Clicks
Total clicks on your links, post images, page title, or call-to-action buttons.
Pro Tip: Always evaluate metrics in context. For example, high reach but low engagement may signal irrelevant or unengaging creative, while low reach but high engagement suggests you should extend distribution.
---
Understanding Audience Demographics and Behaviors
The People section in Facebook Insights delivers a breakdown of your audience’s:
- Age and gender
- Geographic locations
- Preferred languages
- Peak activity times
Use demographic and behavioral data to target ads, refine messaging, and schedule posts effectively.
Example: If most followers are 25–34 years old and active in the evenings, post between 6–9 PM to align with their activity.
---
Analyzing Post Performance in Facebook Insights
Individual post analysis reveals which content performs best. Key elements to monitor:
- Post Type – Video, photo, link, carousel, etc.
- Engagement Rate – Engaged users divided by reach.
- Reactions vs. Comments vs. Shares – Each engagement type reflects different user intent.
- Post Timing – Time and day of publication.
| Post Type | Average Reach | Engagement Rate | Best Time to Post |
|---|---|---|---|
| Video | 5,000 | 6.2% | 6 PM |
| Photo | 4,200 | 5.0% | 12 PM |
| Link | 3,100 | 4.1% | 3 PM |
---
Tracking Page Growth Trends Over Time
Use Insights to monitor follower growth, page likes, and unlikes.
Look for:
- Sustained growth – Indicates effective content and promotion.
- Sudden drops – May point to irrelevant or controversial content.
- Seasonal variations – Align campaigns with high-growth windows.
Analyzing monthly or quarterly trends provides a more reliable view than daily fluctuations.
---
Refining Content Strategy Using Insights
With regular analysis, you can:
- Focus on formats and topics that deliver results.
- Adjust publishing schedules for high-engagement windows.
- Test different copy lengths and tones.
- Optimize calls-to-action for clicks and conversions.
Replicating patterns from high-performing posts often yields consistent results.
---
Identifying Best-Performing Posts to Boost or Repurpose
Filter your Facebook Insights report to find content with:
- High engagement rate
- Strong click-through rate (CTR)
- Positive sentiment in comments
Leverage these by:
- Boosting – Increase reach via paid targeting.
- Repurposing – Convert a successful blog-linked post into a video or infographic.
- Cross-posting – Share across Instagram, LinkedIn, or email.
---
Setting Benchmarks and Measuring Progress
Benchmarks add perspective to your performance tracking. Examples:
- Engagement rate: 5% or higher
- Monthly likes growth: 3%
- Link post CTR: customized per industry
Review performance against these benchmarks monthly to stay on track with goals.
---
Exporting and Customizing Facebook Insights Reports
To share data with teams or clients:
- Choose the date range in the Insights dashboard.
- Select metrics to include.
- Export as CSV or Excel.
Tailor exported reports to highlight KPIs relevant to stakeholders such as sales teams or executives. Customize charts or pivot tables for clarity.

---
Common Mistakes to Avoid in Facebook Insights Analysis
Avoid these pitfalls:
- Mixing up reach and engagement – Each tells a different story.
- Ignoring negative feedback – Hides and unlikes indicate dissatisfaction.
- Obsessing over vanity metrics – Likes alone don’t equal conversions.
- Analyzing too short a timeframe – You need enough data to see trends.
---
Integrating Facebook Insights with Other Analytics Tools
For better attribution and strategic decisions, integrate with:
- Google Analytics – Track on-site behavior from Facebook traffic.
- CRM software – Connect leads to campaigns.
- Social listening tools – Add sentiment data for context.
- Facebook Ads Manager – Compare organic vs. paid metrics.
This 360-degree view lets you refine targeting and content more effectively.
---
Summary and Next Steps
The Facebook Insights report is more than just a data sheet—it’s a guide to better strategy and stronger engagement. To harness it fully:
- Review your Insights weekly.
- Compare month-over-month performance.
- Modify your content plan according to audience behavior.
- Boost and repurpose top posts.
- Avoid common metric misinterpretations.
- Integrate with other tools for a bigger picture.
By making Facebook Insights analysis part of your routine, you’ll improve content quality, grow reach, and increase ROI.
Ready to take your Facebook reporting to the next level? Start by downloading your latest Insights report, identifying your top three posts from last month, and testing boosted distribution this week.