Find When Your Instagram Followers Are Most Active
Learn how to use Instagram Insights to find peak follower activity times and optimize your posting schedule for higher engagement and reach.

How to See When Your IG Followers Are Most Active
Understanding how to see when your IG followers are most active is essential for anyone looking to grow their Instagram account strategically. By posting at times when your audience is online, you increase the chance of more likes, comments, and shares — leading to stronger engagement and greater visibility in the feed. This guide will walk you step-by-step through accessing Instagram Insights, interpreting the data, and using it to optimize your posting schedule.
---
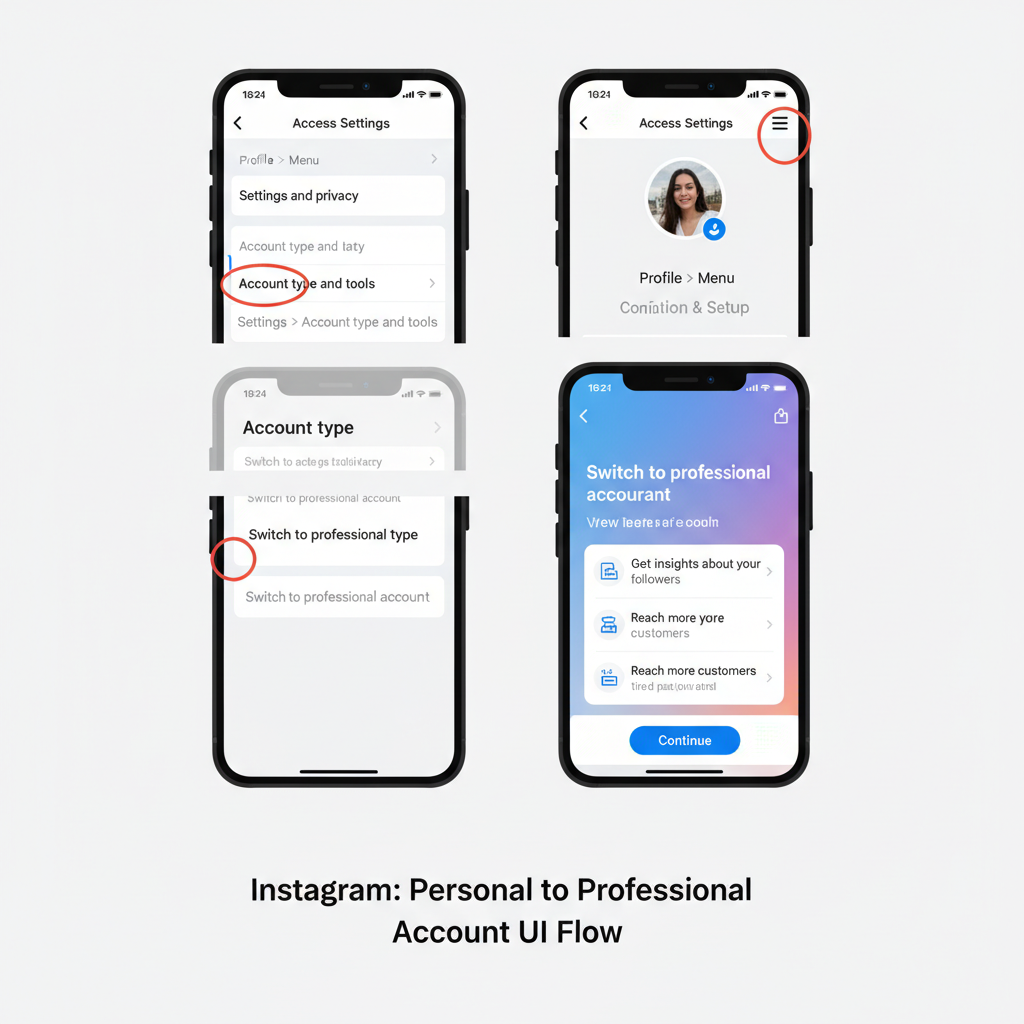
Switch to a Professional Account to Unlock Insights
Instagram’s follower activity data is part of its Insights feature, available only to Professional accounts — either Business or Creator. Switching is free and unlocks valuable metrics about your audience.
How to switch:
- Go to your profile.
- Tap the menu icon (☰) in the top right corner.
- Select Settings and privacy.
- Choose Account type and tools → Switch to Professional account.
- Pick Business or Creator, then follow the prompts.
Tip: Select “Creator” if you’re an influencer, artist, or content creator. Choose “Business” if you represent a company or brand.
---
Navigate to Instagram Insights
Once you have a Professional account, accessing Insights is simple:
- From your profile, tap the menu and select Insights.
- From an individual post, tap View Insights.
While Insights covers a range of engagement statistics, the follower activity section is where you’ll find the timing data you need.
---
Access the "Audience" Tab for Activity Data
Inside Insights:
- Tap the Audience section.
- Scroll to Most Active Times.
- View data presented as Hours and Days charts.
This tells you exactly when your followers are most active on Instagram, allowing you to plan posts for maximum reach.
---
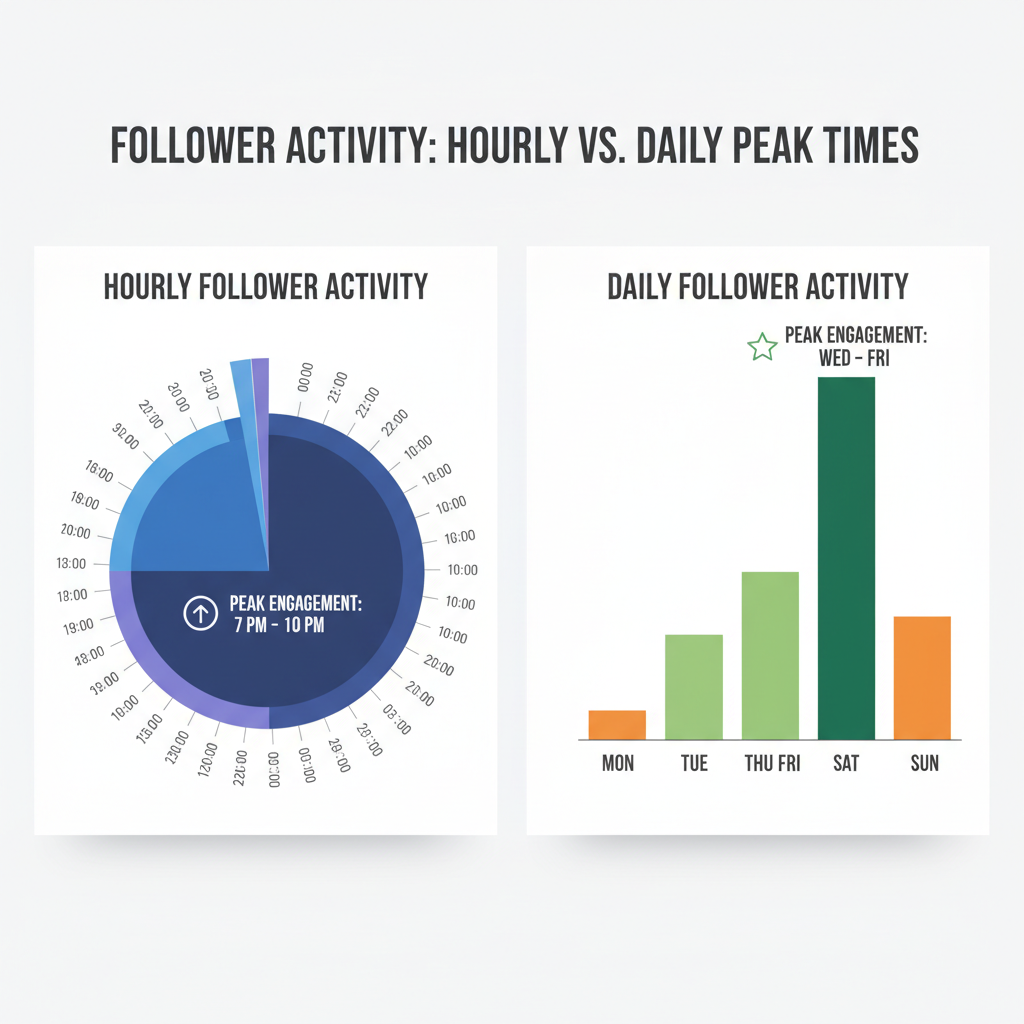
Understand "Most Active Times" Charts
Instagram presents two charts to help you analyze activity:
Hours Chart
- Shows follower activity for each hour, from 0 through 23.
- Taller bars indicate more followers online at that time.
- Example: A spike at 6 PM suggests a good posting slot.
Days Chart
- Displays engagement across Monday through Sunday.
- Taller bars signal days with higher activity.
- Example: A Wednesday peak might mean midweek posts perform better.
These figures are averaged over the past week, so trends can change with audience behavior.
---
Compare Activity Patterns Across Different Days
Spotting patterns across the week helps you fine-tune your schedule. Look beyond one-off spikes and identify consistent peaks.
Example analysis:
| Day | Peak Hour | Possible Reason |
|---|---|---|
| Monday | 8 PM | Users unwind after work |
| Wednesday | 6 PM | Midweek break |
| Saturday | 11 AM | Weekend leisure scroll |
Using these insights, you can schedule posts to align with your audience’s habits.
---
Use External Analytics Tools for Deeper Engagement Tracking
Beyond Insights, third-party analytics platforms can provide extra detail and historical data:
- Later – Automates scheduling and optimizes posting times.
- Hootsuite – Offers in-depth engagement analytics.
- Iconosquare – Tracks advanced follower metrics.
- Sprout Social – Analyzes performance across multiple platforms.
These tools can reveal trends over months, compare campaigns, and identify correlations between timing and engagement.
---
Experiment with Posting at Peak Follower Activity Times
From your data, select the top two or three peak hours and post during them consistently for several weeks.
Example test plan:
- Mondays at 8 PM
- Wednesdays at 6 PM
- Saturdays at 11 AM
Posting methods:
- Post manually using the Instagram app.
- Schedule posts in advance using tools like Buffer, Later, or Hootsuite.
---
Monitor Results via Engagement Rate Changes
Track your engagement rate to measure the impact of your posting schedule.
Formula:
Engagement Rate (%) = (Likes + Comments + Saves) / Followers * 100Monitor performance over two to four weeks to account for weekly cycles and smooth out anomalies from special events or viral posts.
---
Adjust Content Schedule Based on Updated Insights
After your test period:
- Revisit Instagram Insights to check for changes in peak hours/days.
- Remove time slots with low or inconsistent engagement.
- Keep refining your schedule as your audience evolves.
Staying flexible ensures you continue to post at optimal times.
---
Keep Seasonal and Time Zone Variations in Mind
Follower activity is influenced by external factors:
- Seasonality: Holidays, school terms, and vacations alter online habits.
- Time zones: A global audience may require posting at different local times.
Pro Tip: Use the Insights “Location” data to identify where followers are and schedule accordingly.
---
Quick Recap
To discover when your Instagram followers are most active:
- Switch to a Professional account.
- Open Insights → Audience → Most Active Times.
- Compare hours and days charts.
- Experiment with high-activity time slots.
- Track engagement rates and adjust.
- Consider seasonality and time zones.
---
Final Thoughts
Finding out how to see when your IG followers are most active is one of the most effective ways to increase engagement. Use the Audience tab in Insights to identify peak hours and days, test different posting times, and refine your schedule based on real performance data. Over time, this data-driven approach will sync perfectly with your followers’ habits, helping you boost visibility and achieve your Instagram growth goals.
Ready to optimize your posting schedule? Start using Instagram Insights today and watch your engagement soar.