TikTok Data Viewer Guide for Account Performance Analysis
Learn how to use TikTok data viewers and analytics tools to track account growth, monitor engagement, and analyze competitor and hashtag performance.
Introduction to TikTok Data Viewers
TikTok has rapidly evolved into one of the most influential social media platforms for creators, brands, and influencers. With fast-changing trends, viral content cycles, and a young, engaged audience, understanding what’s working on TikTok is critical for reaching marketing goals and improving content performance. A TikTok data viewer is a specialized tool that helps users analyze content metrics, track growth rates, and gain actionable insights into audience behavior for strategic planning.
Legitimate use cases include:
- Monitoring your own account’s growth and engagement.
- Conducting competitor research for benchmarking.
- Tracking hashtag performance for campaign planning.
- Measuring ROI from advertising and influencer collaborations.

By leveraging accurate data, creators and marketers can adapt strategies swiftly, making evidence-based decisions instead of relying solely on guesswork.
---
TikTok Analytics vs. Third-Party Data Viewer Tools
TikTok offers native analytics for Creator and Business accounts, providing a range of metrics. Third-party TikTok data viewers expand these capabilities by aggregating public and sometimes proprietary data to deliver more detailed reporting.
Key differences include:
- Scope: Native analytics only show your own account data, while third-party tools often display competitor stats and trend analyses.
- Interface: Third-party viewers may offer customizable dashboards, exports, and filters not available in the native app.
- Functionality: External tools often include advanced visualization, AI-driven insights, and cross-platform comparisons.
Using both in combination can give a holistic view: native analytics for accurate account-specific data and third-party data viewers for competitive intelligence.
---
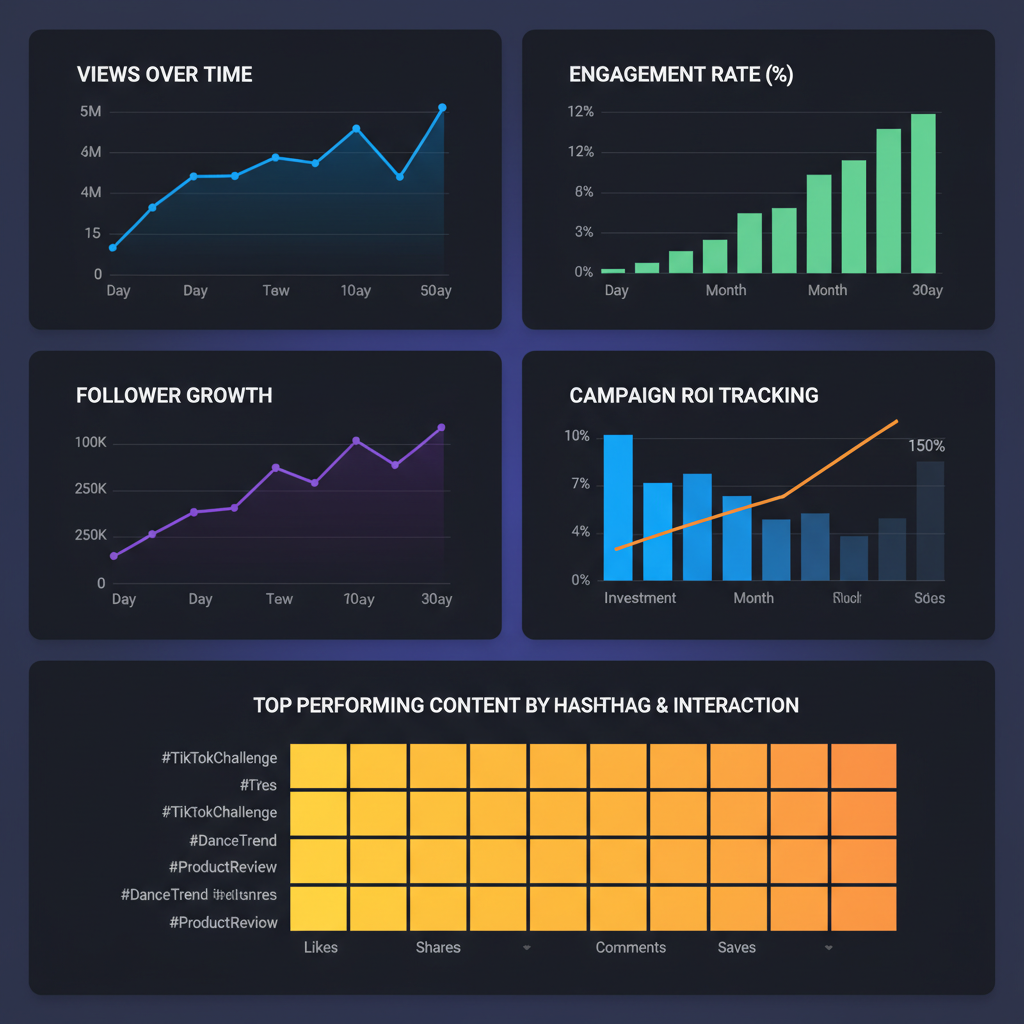
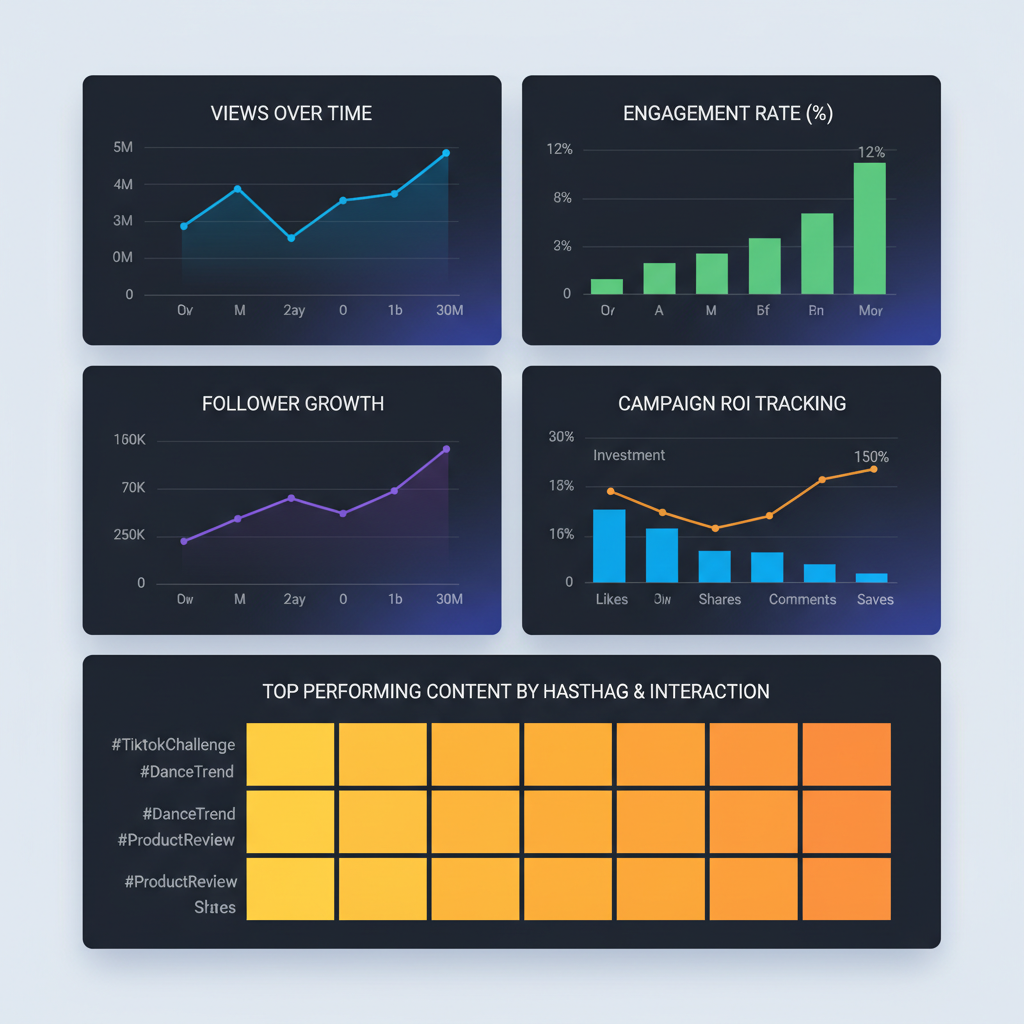
Key Metrics to Track with a TikTok Data Viewer
Whether you use TikTok’s built-in analytics or a third-party dashboard, there are several core metrics you should monitor consistently:
- Follower Growth Rate
- Percentage change in followers over a period — helps identify momentum and brand reach expansion.
- Average Views per Post
- Indicates consistent reach beyond one-off viral spikes.
- Engagement Rate (ER)
- Combines likes, comments, shares, and views to show how interactive your audience is.
- Hashtag Reach
- Measures how far your content spreads through specific hashtags.
- Audience Demographics
- Age, gender, and location — crucial for targeting and localization.
---
| Metric | Formula | Why It Matters |
|---|---|---|
| Follower Growth Rate | (New Followers / Total Followers) × 100 | Indicates brand momentum and changes in popularity. |
| Average Views | Total Views ÷ Number of Posts | Shows consistent reach potential. |
| Engagement Rate | ((Likes + Comments + Shares) / Views) × 100 | Evaluates content resonance and community interaction. |
---
Accessing TikTok’s Built-In Analytics
TikTok gives account owners access to basic and advanced analytics, depending on account type.
For Creator Accounts:
- Switch to a Creator account in Settings.
- Go to your profile and tap the three dots (or lines) in the top right.
- Select “Creator Tools” → “Analytics.”
For Business Accounts:
- Switch to a Business account in Settings.
- Tap the “Business Suite” option.
- Access “Analytics” for more ad-focused metrics like CTR.
Native analytics are ideal for validating your own content performance without privacy concerns.
---
Evaluating Third-Party TikTok Data Viewers
Before adopting a third-party TikTok data viewer, assess it against the following criteria:
- Feature Set: Competitor tracking, hashtag analytics, historical data.
- Accuracy: How close the data matches TikTok’s native figures.
- Data Security: Compliance with TikTok’s terms and industry privacy standards.
- Usability: Interface design, export options, integrations.
- Cost: Subscription tiers versus free trials.
---
Step-by-Step Guide: Using TikTok Data Viewer for Competitor Analysis
A TikTok data viewer can be a powerful asset for benchmarking:
- Identify Competitors: Choose 5–10 accounts in your niche.
- Import or Search: Use the tool’s search to follow their public metrics.
- Benchmark Metrics: Compare follower growth, post frequency, ER.
- Track Content Patterns: Note timing, themes, and music choices.
- Apply Insights: Adjust your posting schedule and styles accordingly.
---
Spotting Content Trends and Hashtags Using Collected Data
Trend detection is one of the most valuable functions of a TikTok data viewer. By evaluating hashtags, sound clips, and video styles:
- Identify rising hashtags: Look for sustained increases in views and followers linked to certain tags.
- Monitor sound popularity: Some audio tracks boost engagement rates.
- Observe visual styles: Trends like “text overlay storytelling” or “mini-vlogs” may surge in your niche.
Leveraging trend data helps you join conversations at peak relevance — essential for maximizing viral potential.
---
Measuring ROI from TikTok Campaigns
If you run paid campaigns or collaborate with influencers, tracking return on investment is essential.
ROI calculation formula:
ROI (%) = ((Revenue from Campaign - Campaign Cost) / Campaign Cost) × 100Use a TikTok data viewer to link campaign spend to changes in:
- Follower growth.
- Audience reach.
- Engagement rates.
- Conversion metrics (e.g., clicks, installs).
---
Compliance and Privacy Considerations
TikTok’s terms of service and privacy rules limit certain automated data gathering. Always:
- Verify API compliance: Ensure approved endpoint usage.
- Avoid scraping private data: Access only public metrics.
- Meet GDPR/CCPA standards: If storing user data, ensure full regulatory compliance.
Maintaining compliance avoids legal issues and builds audience trust.
---
Tips for Turning Insights into Content Strategy Improvements
Metrics drive results when applied strategically:
- Optimize posting times: Schedule uploads during peak engagement periods.
- Refine themes: Focus on high-ER content types.
- Experiment: Test new formats while tracking results.
- Align hashtags: Match your tags to trending topics for greater discoverability.
---
Common Mistakes to Avoid When Interpreting TikTok Data
Stay clear of these pitfalls:
- Overreacting to single viral posts — prioritize long-term trends.
- Ignoring engagement composition — shares and comments matter as much as likes.
- Confusing causation with correlation — external factors may affect views.
- Neglecting qualitative insights — comments give vital context.
---
Conclusion: Choosing the Right Tool for Growth
A TikTok data viewer — native or third-party — can be pivotal for sustainable growth. Combining TikTok’s analytics with competitive tracking creates a balanced strategy, enabling you to monitor KPIs, detect emerging trends, and measure campaign ROI.
Keep compliant, interpret data wisely, and adapt based on solid insights. This approach fosters stronger community engagement, higher reach, and measurable success.
Ready to take your TikTok presence to the next level? Start by integrating a reliable TikTok data viewer into your content workflow today.