Analytics.Twitter.com Guide to Improve Twitter Performance
Learn how to use analytics.twitter.com to track tweet performance, analyze audience insights, and improve Twitter reach, engagement, and growth.

Introduction to Analytics.Twitter.com and Its Purpose
Analytics.twitter.com is Twitter’s built‑in analytics platform that enables individuals, businesses, and marketers to track their Twitter performance in real time. It transforms raw engagement data into actionable insights, helping you understand your audience’s behavior, refine your messaging, and ultimately grow your reach and influence. Whether you are an influencer looking to increase engagement or a brand optimizing ad spend, Twitter Analytics offers a consolidated, user‑friendly view of your content performance.
At its core, analytics.twitter.com provides:
- Tweet Activity Analysis – See how individual tweets are performing.
- Audience Insights – Learn more about who follows you.
- Campaign Tracking – Monitor promoted tweets and ad campaign metrics.
- Trend Monitoring – Understand shifts in engagement over time.
---
How to Access Twitter Analytics (Desktop and Mobile)
Accessing Twitter Analytics is straightforward and free for all Twitter users.
On Desktop
- Log in to your Twitter account.
- Visit https://analytics.twitter.com.
- Alternatively, click More on the left menu inside Twitter, then choose Analytics.
- You’ll be taken to the dashboard, which shows the last 28 days by default.
On Mobile
While there is no dedicated analytics dashboard inside the Twitter mobile app, you can:
- Use the in‑app View Tweet activity option on each tweet.
- Open analytics.twitter.com via a mobile browser.
- Install third‑party apps authorized to access your Twitter data for enhanced portability.
---
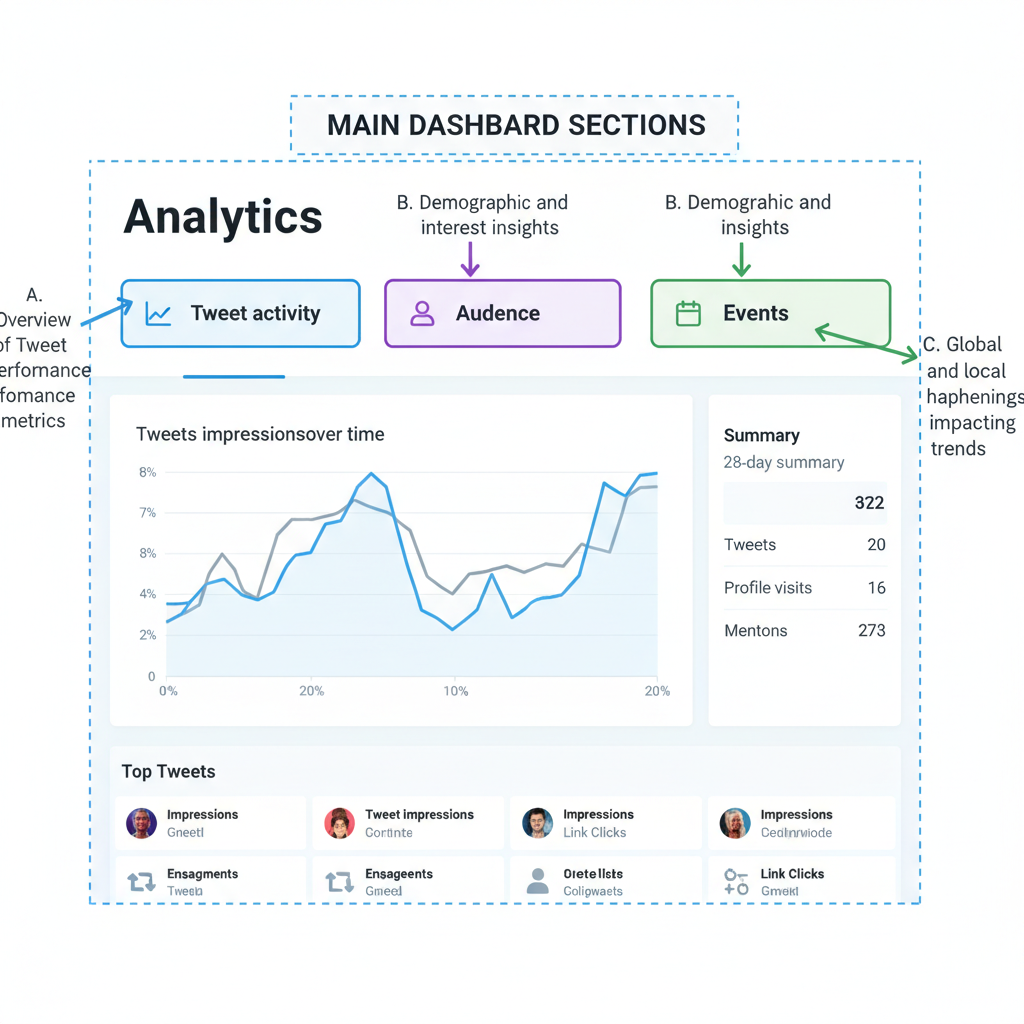
Overview of the Twitter Analytics Dashboard and Main Sections
When you land on analytics.twitter.com, the dashboard greets you with a Home overview page summarizing the last 28 days.
The main sections include:
- Tweets: Detailed performance for each tweet including impressions, engagements, and engagement rates.
- Audience: Demographic and interest profiles of your followers.
- Events: Trending topics and events to inspire timely content.
- More: Access to campaign reports if running Twitter Ads.
---
Understanding Tweet Activity Metrics
Having clarity on key metrics is fundamental for proper analysis.
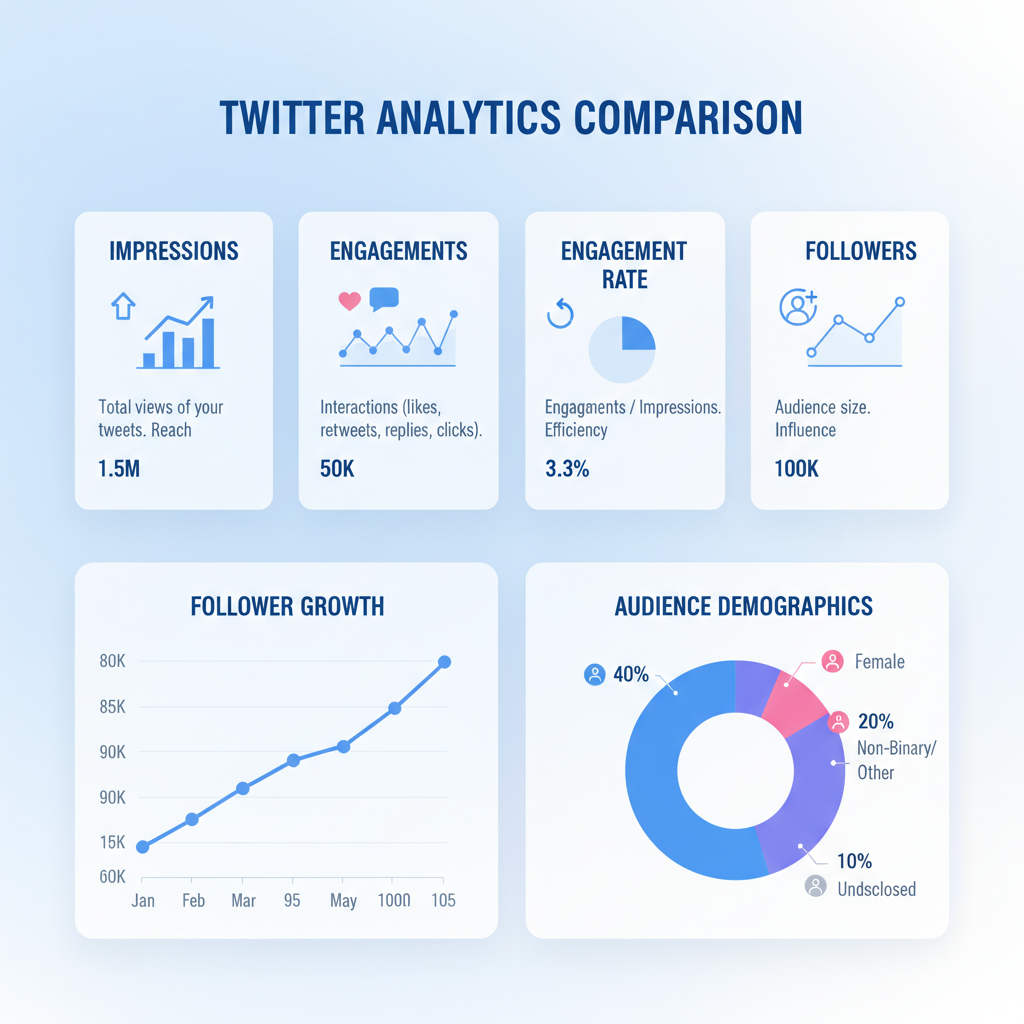
Key Twitter Metrics
| Metric | Definition | Why It Matters |
|---|---|---|
| Impressions | The number of times a tweet appeared in users’ timelines or search results. | Indicates reach and visibility. |
| Engagements | Total times users interacted with a tweet (clicks, retweets, replies, likes, follows). | Measures how compelling the content is. |
| Engagement Rate | Engagements divided by impressions. | Reveals content effectiveness relative to reach. |
Monitoring these allows you to assess not just how far your tweets travel, but also how impactful they are.
---
Analyzing Follower Growth and Audience Demographics
The Audience tab on analytics.twitter.com uncovers:
- Follower Count Trends – Monitor growth or decline over time.
- Location Data – Know where your audience is concentrated.
- Gender and Interests – Understand what topics resonate.
- Device Usage – Identify if users engage via desktop or mobile.
By examining these insights you can:
- Align content themes with your followers’ top interests.
- Schedule tweets when your primary audience’s region is most active.
- Tailor media formats (image sizes, video orientation) to their preferred devices.
---
Identifying Top Tweets and Replicating Success
Twitter Analytics highlights your top‑performing tweet each month based on impressions and engagements. This helps you:
- Identify which formats (e.g., video, image, poll) spark the most interaction.
- Spot effective tones, hashtags, and call‑to‑action (CTA) styles.
- Reproduce content patterns that generated exceptional results.
For example, if images consistently outperform text‑only tweets, you can prioritize visual content in your posting calendar.
---
Tracking Trends in Profile Visits and Mentions
On the Home tab, you’ll see metrics like:
- Profile Visits – How many users visited your profile from tweets.
- Mentions – How often your handle was mentioned by others.
Rising profile visits often mean your content is prompting curiosity or deeper exploration of your brand. Increasing mentions can signal growing conversation and advocacy.
Track these trends monthly to correlate peaks with specific campaigns or viral tweets.
---
Using Data to Refine Posting Times and Content Formats
Data from analytics.twitter.com can help you discover:
- Which days yield the highest engagement rates.
- The time windows when your audience is most responsive.
Practical steps:
- Export tweet data from the Tweets tab for a broader timeframe.
- Analyze timestamps vs. engagement in a spreadsheet.
- Test different posting times and monitor changes.
Similarly, compare engagement rates across content formats — links vs. images vs. videos — to tweak future strategies.
---
Monitoring Campaign Performance With Twitter Analytics
If you run Twitter Ads, integrating ad performance into the same analytics view simplifies optimization. In the More section, you’ll find:
- Cost Per Engagement (CPE)
- Click‑Through Rate (CTR)
- Conversion Tracking (when configured)
This lets you monitor whether paid promotion amplifies organic engagement and reaches the right audiences. Adjust budgets and targeting as you learn which demographics and creatives work best.
---
Integrating Analytics Insights With Other Marketing Tools
Twitter Analytics becomes even more powerful when used alongside external tools:
- Google Analytics – Connect Twitter referral traffic data to on‑site behavior.
- Social Media Schedulers – Inform content calendars with proven engagement times.
- CRM Systems – Merge engagement data with leads and your sales pipeline.
By bridging platforms, you can convert tweet engagement metrics into tangible ROI indicators.
---
Common Mistakes to Avoid When Interpreting Analytics Data
When leveraging analytics.twitter.com, avoid these pitfalls:
- Focusing Solely on Vanity Metrics – High impressions without proportional engagement may suggest superficial interest.
- Ignoring Small Sample Sizes – A single viral tweet can distort short‑term averages.
- Neglecting Context – Always compare against similar days/weeks, not unrelated periods.
- Assuming Causality Without Testing – Correlation doesn’t always equal causation.
Always validate assumptions with ongoing experiments for reliable insights.
---
Concluding Tips for Continuous Performance Improvement
To maximize Twitter success using analytics.twitter.com:
- Check Analytics Regularly – Weekly reviews foster proactive adjustments.
- Set Clear Goals – Whether aiming for more followers or higher engagement, know your objective.
- Experiment and Learn – Test varied formats, tones, and timings.
- Iterate Campaigns – Use past reports to inform future content planning.
---
Summary and Next Steps
With analytics.twitter.com, you gain more than just numbers — you gain a roadmap to deeper connections, smarter campaigns, and measurable business impact. From understanding your best tweet formats to optimizing posting schedules, the platform’s insights empower you to refine strategies and strengthen your Twitter presence.
Start today: log into your Twitter Analytics dashboard, explore each section, and apply the data to your next week’s content. Consistent measurement and adaptation are the keys to sustainable Twitter growth.