How to Use Instagram Stories for Marketing: A Practical, Data-Driven Playbook
Build a repeatable Instagram Stories system. Get strategy, templates, formats, features, and metrics to plan fast, ship daily, and turn followers into customers

Use this practical guide to structure, design, and measure Instagram Stories that consistently drive business outcomes. It organizes strategy, formats, features, cadence, and analytics so you can move from ad hoc posting to a repeatable, performance-oriented system. Skim the frameworks and templates to plan quickly, then ship fast and iterate with data.
How to Use Instagram Stories for Marketing: A Practical, Data-Driven Playbook
Instagram Stories sit at the intersection of attention and action. They’re full-screen, fast, and familiar—perfect for moving your audience from passive scrollers to active buyers. If you’ve wondered how to use Instagram Stories for marketing in a way that’s systematic and measurable, this playbook gives you the strategy, formats, and metrics to execute.
Why Instagram Stories Matter Today
Stories meet users where they already are: tapping through quick, immersive content between moments. They complement the Feed and Reels by offering:
- High intent touchpoints: People who view your Stories often already follow or recognize you—warm attention is easier to convert.
- Ephemeral urgency: The 24-hour window increases FOMO and nudges action.
- Algorithmic engagement signals: Replies, reactions, link clicks, sticker interactions, and retention (completion rate) signal quality engagement, helping your future content get surfaced more.
- Vertical, distraction-free canvas: Full-screen format focuses attention on one thing at a time.
Where Reels expand reach to new audiences, Stories excel at nurturing existing followers into customers.
Define the Strategy
Before you post, design your system.
- Objectives: Map each Story sequence to one primary goal:
- Awareness (introduce, educate)
- Traffic (site visits, blog reads)
- Leads (email capture, DM opt-ins)
- Sales (checkout, booking, inquiry)
- Audience personas: Identify 2–3 segments with pains, objections, and triggers. Tailor hooks and CTAs accordingly.
- Content pillars: 3–5 pillars to stay consistent. Example: Education, Social Proof, Product, Community, Founder.
- Brand voice: Decide tone (e.g., helpful, witty, bold) and write 1–2 sentences that define it.
- Visual identity: Lock in colors, fonts, and layout rules. Create reusable templates for speed and consistency.
Tip: Build a 10–15 template kit (cover, tutorial steps, quote, before/after, UGC, offer, FAQ, poll) so you can ship daily without reinventing the wheel.
High-Converting Story Formats
These formats pull attention and drive action. Pair each with a single clear CTA.
- Behind-the-scenes: Humanize your brand. Metric to watch: replies.
- Product demos: Show outcomes, not features. Metric: link stickers, exits (to diagnose clarity).
- Mini-tutorials (3–6 slides): Teach one micro-skill. Metric: completion rate.
- Before/after: Visual proof of transformation. Metric: shares and saves (via DM).
- User-generated content: Reposts and duet-style commentary. Metric: mentions, social proof.
- Testimonials: Short quotes with a face or voice. Metric: completion rate and reply DMs like “How do I get this?”
- Limited-time offers: 24-hour promos fit Story ephemerality. Metric: link clicks, sticker taps, conversions.
- Social proof compilations: Press logos, ratings, “as seen on” slides. Metric: forward taps (healthy pacing).
Pro tip: Alternate “high cognitive load” slides (demos, text-heavy) with “low load” slides (visuals, breathing room) to reduce exits.
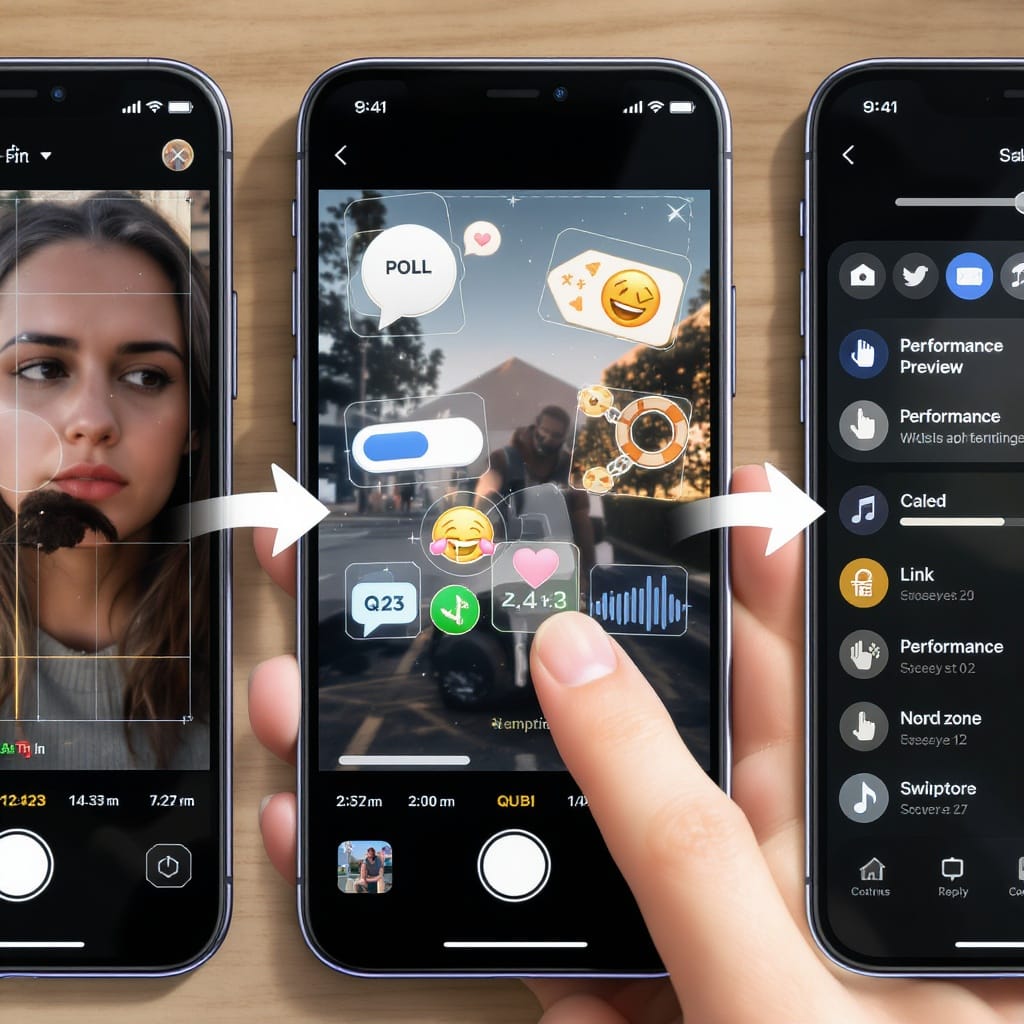
Feature Mastery for Impact
Use interactive features intentionally and align them to funnel stages.
| Feature | Best Use | Funnel Stage | KPI | Notes |
|---|---|---|---|---|
| Poll | Split opinions, qualify interest | Awareness → Consideration | Poll votes, completion rate | Use to segment: follow up with tailored Stories |
| Questions | Collect objections and content ideas | Consideration | Replies, tap-backs | Answer top questions in the next sequence |
| Quiz | Teach + test micro-knowledge | Awareness | Quiz taps, completion | Reinforce correct answer on next slide |
| Countdown | Launches, webinars, drops | Consideration → Conversion | Reminder sign-ups, link clicks | Post reminders 4h and 30m before deadline |
| Link sticker | Drive traffic to landing pages | Conversion | Link clicks, conversions (via UTM) | Use action verbs + benefit (“Get the checklist”) |
| Location | Local discovery, events | Awareness | Reach, discovery | Pair with geo-relevant hashtags in caption |
| Mentions | Amplify partners/UGC | Awareness | Reshares, new follows | Prompt partners to reshare for extra reach |
| Music | Mood, pacing, memorability | Awareness | Completion rate | Ensure licensing via Instagram’s library |
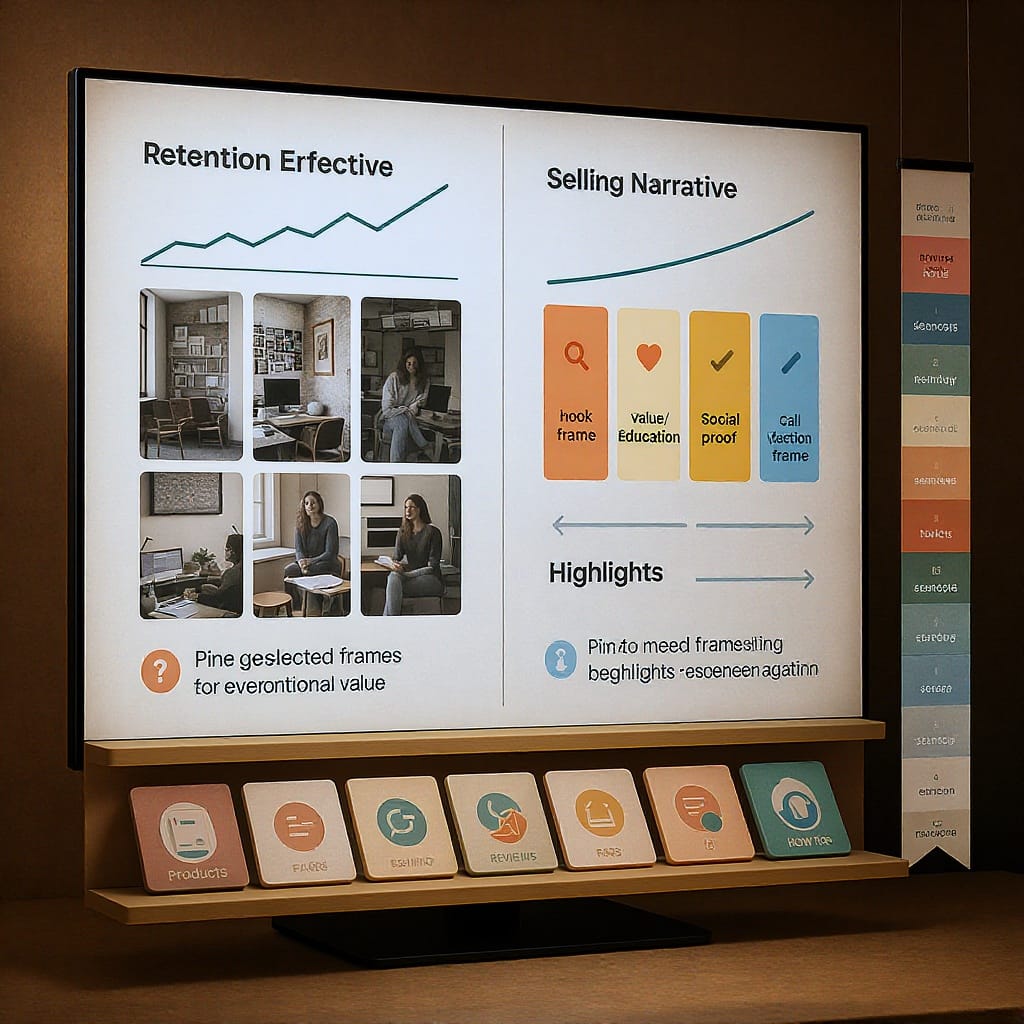
Storytelling That Sells
Great Stories are engineered for retention and action.
- Hook-first slide
- Lead with the payoff: “Stop losing 30% of your ad spend—try this.”
- Visual curiosity: tight close-up, bold headline, pattern break.
- Promise the roadmap: “In 4 slides.”
- Narrative arcs (3–6 slides)
- Problem → Agitate → Solve → Proof → CTA
- Myth → Truth → Process → Example → CTA
- Before → Tension → After → Social Proof → CTA
- Pacing signals
- High taps forward: content might be skim-friendly or too slow—test faster cuts or larger text.
- Exits: friction is high—reduce clutter, clarify message, or shorten sequence.
- Tap-backs: good sign of interest; consider adding a saveable recap slide.
- Slide-level CTAs
- Micro-CTAs per slide: “Vote to see Step 2,” “Tap link for template,” “DM ‘Guide’.”
- Final strong CTA: one action, one link.
- Copy best practices
- 10–20 words per slide max; break lines for rhythm.
- Use verbs and outcomes (“Get,” “Save,” “Book”) over features.
- Front-load benefits in the first 2 slides.
- Accessibility
- Always add on-screen captions for spoken audio.
- Use readable typography (min ~36–48 pt equivalent), high contrast, and sufficient line spacing.
- Avoid red/green-only signaling; use icons and labels.
- Keep critical text in the “safe zone” (roughly center 1080×1420). Avoid the top (profile area) and bottom (reply bar) UI overlays.
Cadence and Timing
Consistency trains both your audience and the algorithm.
- Posting windows
- Post when your followers are most active (check Insights → Total followers → Most active times).
- Cover multiple time zones: schedule a morning and evening slot for your top regions.
- Sequence length
- 3–6 slides for education/sales; 1–3 slides for announcements; up to 10 for launches (with pacing).
- Weekly programming
- Teach your audience what to expect. Repeatable slots reduce planning friction.
| Day | Theme | Format | Primary KPI |
|---|---|---|---|
| Monday | Motivation/Proof | UGC + testimonial | Completion, replies |
| Tuesday | Tip Tuesday | 3-slide tutorial + quiz | Completion, quiz taps |
| Wednesday | Behind the Scenes | Process reveal + Q&A sticker | Replies, questions |
| Thursday | Offer/Lead Magnet | Countdown + link sticker | Link clicks, sign-ups |
| Friday | Feature Friday | Product demo + poll | Poll votes, exits |
- Batching and scheduling
- Script and design in batches (1–2 hours/week).
- Use Meta Business Suite or approved partners to schedule Stories.
- Maintain a swipe file of hooks, proofs, and FAQs to drop into templates.
Highlights for Evergreen Value
Treat Highlights like your mobile landing page.
- Organize by intent
- Start Here, FAQs, Reviews, Shop, Tutorials, Results, Events, Press.
- Cover design
- Consistent iconography and color system; readable labels.
- Maintenance
- Quarterly refresh: prune outdated offers, pin your best sequences.
- Conversion path
- Each Highlight should end with a next step: link sticker, DM keyword, or profile link prompt.
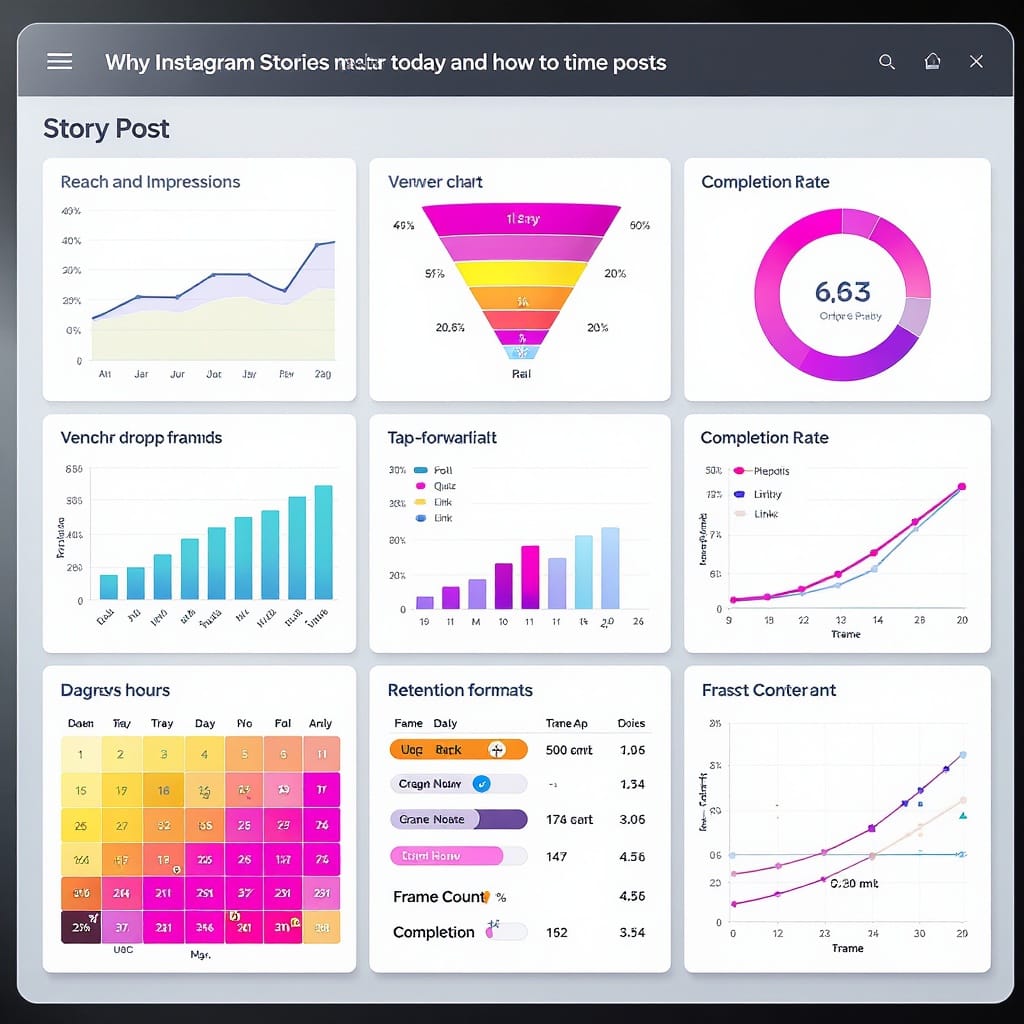
Measure What Matters
Move beyond vanity metrics. Track behavior and iterate.
| Metric | What it indicates | How to use it |
|---|---|---|
| Reach | Unique viewers | Top-of-funnel interest; compare to follower count |
| Impressions | Total views including replays | Content stickiness; high vs. reach indicates replays |
| Completion rate | Retention across slides | Use to judge pacing and clarity |
| Taps forward/back | Skimming vs. rewatch interest | Optimize speed and density of information |
| Exits | Drop-off friction | Diagnose confusing slides or weak hooks |
| Replies | Depth of engagement | Qualitative insights; cue for sales conversations |
| Sticker taps | Feature engagement | Polls/quizzes as interest signals; segment follow-ups |
| Link clicks | Traffic intent | Use UTM to attribute conversions |
- Useful formulas
Completion rate (%) = (Viewers of last slide / Viewers of first slide) * 100

Tap-forward rate (%) = (Taps forward / Impressions) * 100

Exit rate per slide (%) = (Exits on slide / Impressions on slide) * 100- UTM tagging
- Tag every link sticker to attribute traffic and conversion.
https://example.com/offer
  ?utm_source=instagram
  &utm_medium=story
  &utm_campaign=summer_launch
&utm_content=hook_A- Cohort analysis
- Group sequences by hook type (pain vs. promise), content format (demo vs. testimonial), or day/time.
- Compare completion, link clicks, and conversions by cohort to decide what to scale.
From Organic to Paid
Turn your top-performing Stories into Story Ads to scale outcomes.
- When to promote
- Organic sequences with above-median completion rate and link click-through are prime candidates.
- Creative specs and safe zones
- Aspect ratio: 9:16 (1080×1920 px).
- Keep critical text and logos within the central safe area (avoid top profile bar and bottom reply bar).
- Use large typography and high contrast; add captions on talking-head creatives.
- Duration: up to 15s per card (stitch multiple for sequences).
- Targeting and retargeting
- Warm audiences: engagers, website visitors (30–90 days), email lists.
- Lookalikes: seed from highest-value customers.
- Dynamic product ads for catalog sellers.
- A/B testing
- Test hooks (first 2 seconds), CTAs (Shop Now vs. Learn More), and angle (pain vs. promise).
- Keep one variable per test; run to statistically meaningful sample sizes.
- Budget allocation
- 60–70% to proven evergreen creatives, 20–30% to testing, 10% to seasonal spikes.
- Compliance considerations
- Follow Meta ad policies (claims, personal attributes, special categories).
- Ensure you have rights to all music and visuals; use IG’s licensed music library or royalty-free sources.
Practical Production Toolkit
Use these lightweight templates to speed up execution.
- Story slide brief (per sequence)
Goal: Conversion (lead magnet)
Persona: Freelancer, time-poor, tool-curious
Hook (Slide 1): “Steal my 1-page client brief (free)”
Arc: Problem → Process → Preview → CTA
Assets: 2 screenshots, 1 testimonial, brand template #3
CTA: “Get the template” (link sticker with UTM)- Narrative shell you can reuse
1: Hook (promise + timeframe)
2: Context (mistake/myth)
3: The fix (one actionable step)
4: Proof (mini case result)
5: CTA (link or DM keyword)
A 30-Day Execution Plan
- Week 1: Build templates, define pillars, ship 4 sequences, set UTM standards.
- Week 2: Introduce polls/quizzes, launch one lead magnet sequence, create Highlights “Start Here” and “FAQs.”
- Week 3: Add testimonials and before/after; begin cohort tracking by hook type.
- Week 4: Promote the best-performing sequence as a Story Ad; A/B test hooks and CTA.
Final Thoughts
If you’re serious about how to use Instagram Stories for marketing, think in systems: repeatable templates, clear objectives, ruthless measurement, and steady iteration. Start small, ship daily, and let your metrics tell you what to scale. Stories aren’t just fleeting moments—they’re your most direct, full-screen path from attention to action.
Summary: The most reliable results come from clear goals, consistent templates, smart use of interactive features, and disciplined measurement. Build a weekly program, double down on what your cohorts prove works, and extend wins into Highlights and Story Ads. Keep optimizing for completion rate and link clicks, and your Story channel will compound over time.