How to Use LinkedIn Analytics to Improve Your Profile
Learn how to leverage LinkedIn Analytics to track profile views, optimize keywords, and boost audience engagement for career growth.

How to Use LinkedIn Analytics to Boost Your Profile
LinkedIn is more than a static online résumé — it’s a vibrant professional networking hub where individuals build connections, share expertise, and discover opportunities. One of the most effective yet underutilized tools available is LinkedIn Analytics. By learning how to use LinkedIn Analytics to boost your profile, you can uncover actionable data about your audience, content performance, and keyword visibility, then transform these insights into measurable career growth.
This comprehensive guide walks you through key metrics, strategic adjustments, and practical steps to use analytics for maximum impact.
---
Understanding What LinkedIn Analytics Offers
LinkedIn Analytics tracks multiple data categories that reveal your visibility and influence within the platform:
- Profile Views: Number of people visiting your personal profile in a given time frame.
- Post Impressions: How often your posts appear in user feeds.
- Search Appearances: Frequency of your profile showing up in LinkedIn searches.
- Engagement Metrics: Likes, comments, shares, and other user interactions.
- Demographic Insights: Viewer distribution by location, industry, job title, and company size.
These insights form the backbone of a data-driven LinkedIn strategy.
---
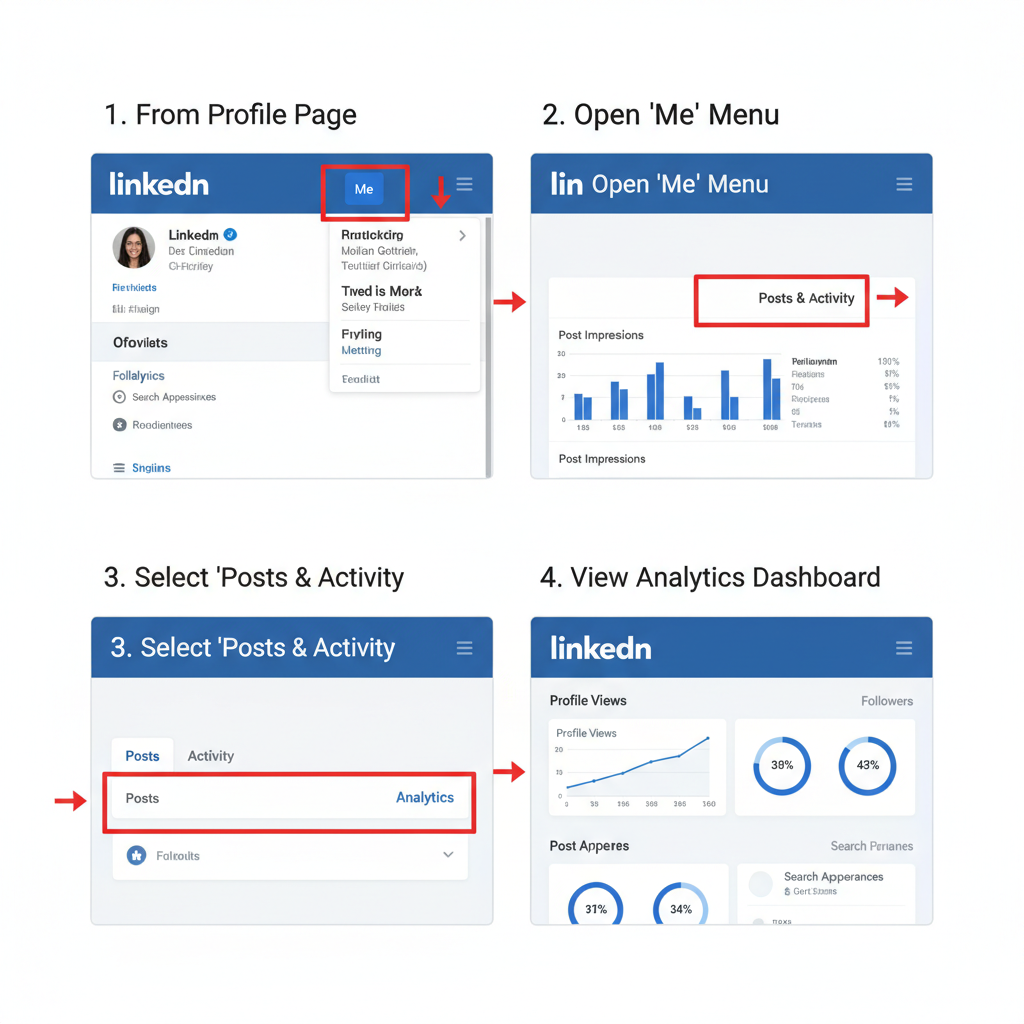
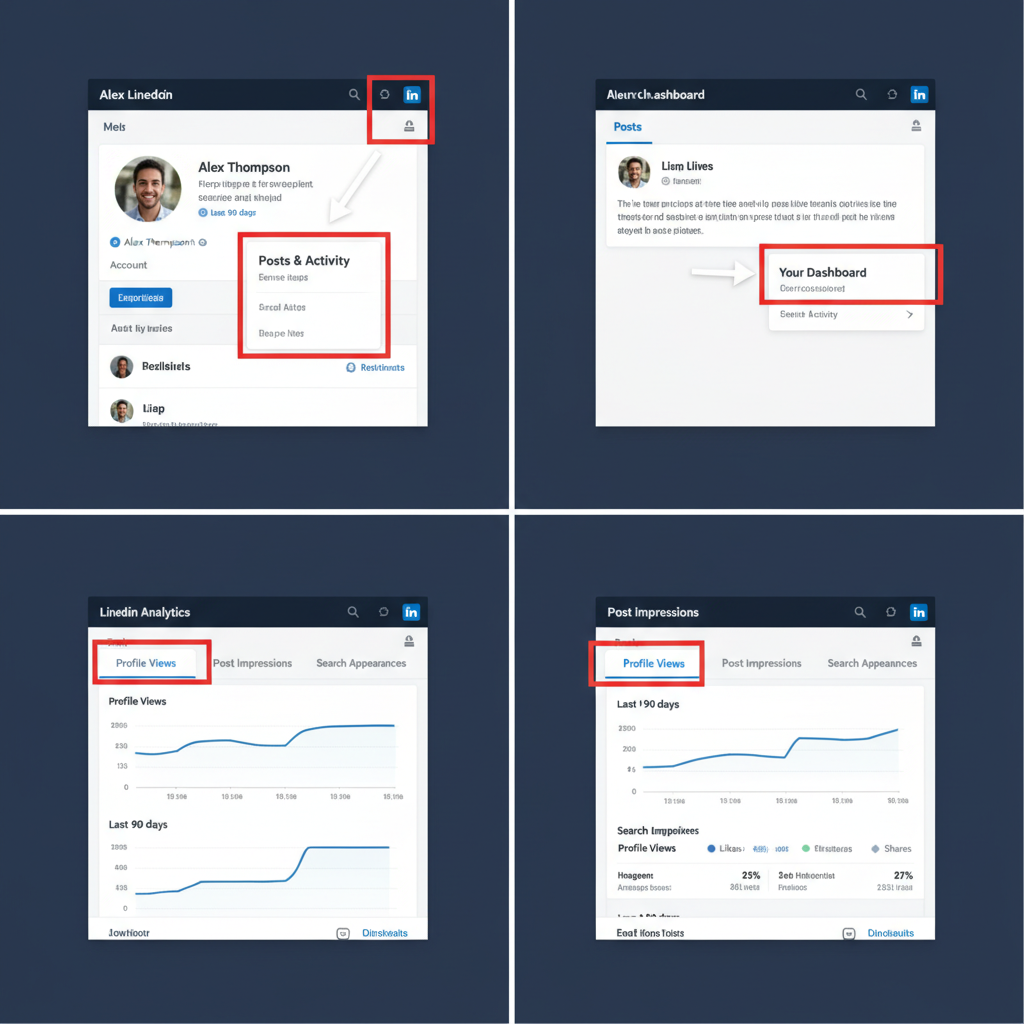
Locating the LinkedIn Analytics Dashboard
Many users miss the full capabilities of LinkedIn Analytics because the dashboard is hidden in profile and post menus.
- Navigate to Your Profile
- Click your profile photo in the top navigation bar, then choose “View Profile.”
- Scroll to the Analytics Section
- Spot the mini dashboard with profile views, post impressions, and search appearances.
- Expand for More Detail
- Select “Show all analytics” for deeper charts and statistics.
For company pages, access analytics via the Admin Tools menu under “Analytics” to view audience and content performance.
---
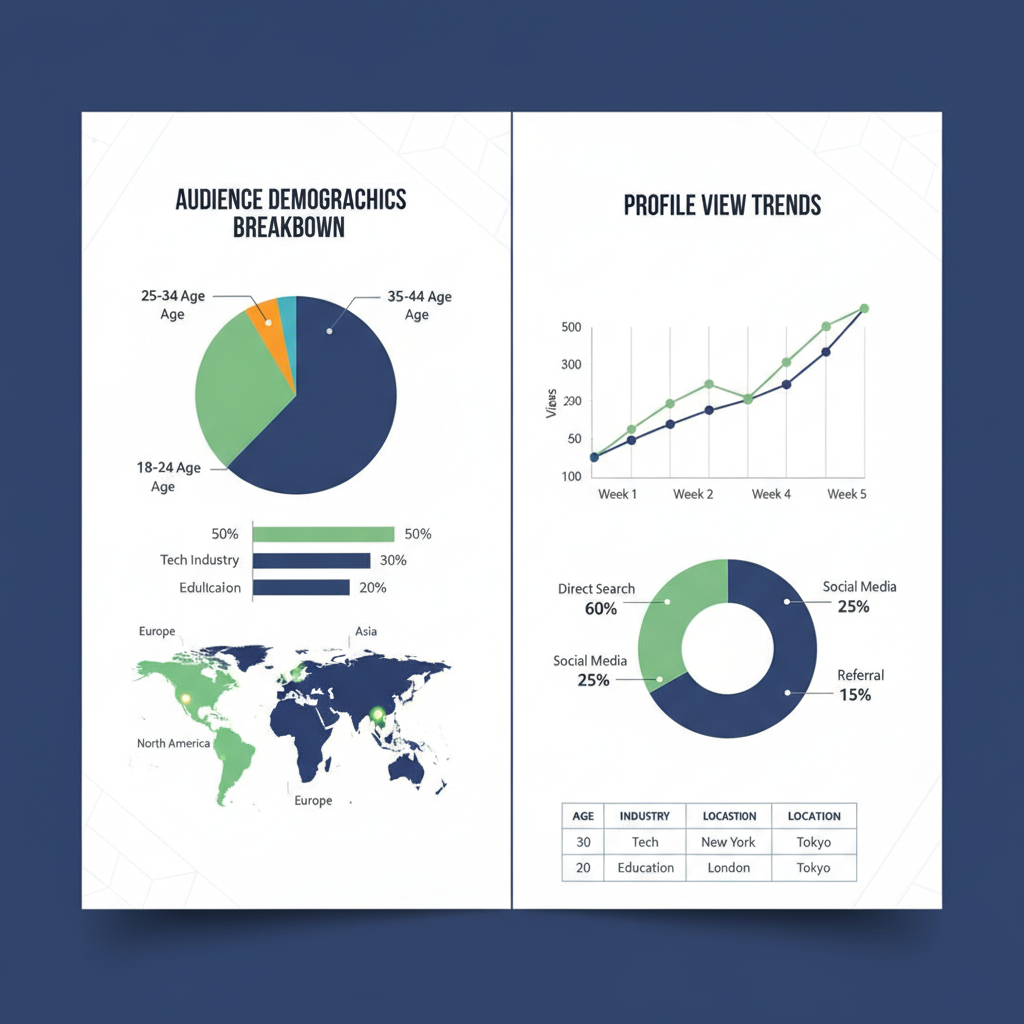
Analyzing Profile View Trends and Audience Demographics
Monitoring who visits your profile can reveal your reach and professional alignment:
- Spikes in Views: Often tied to publishing engaging posts or commenting on trending topics.
- Steady Traffic: Indicates optimized headline and summary content.
- Demographic Breakdowns: Align your updates with the industries and locations of viewers.
Example Table: Demographic Snapshot
| Metric | Top Segment | Percentage |
|---|---|---|
| Location | New York, USA | 25% |
| Industry | Marketing & Advertising | 40% |
| Job Title | Marketing Manager | 30% |
Tailoring content to your strongest audience segments can greatly improve engagement.
---
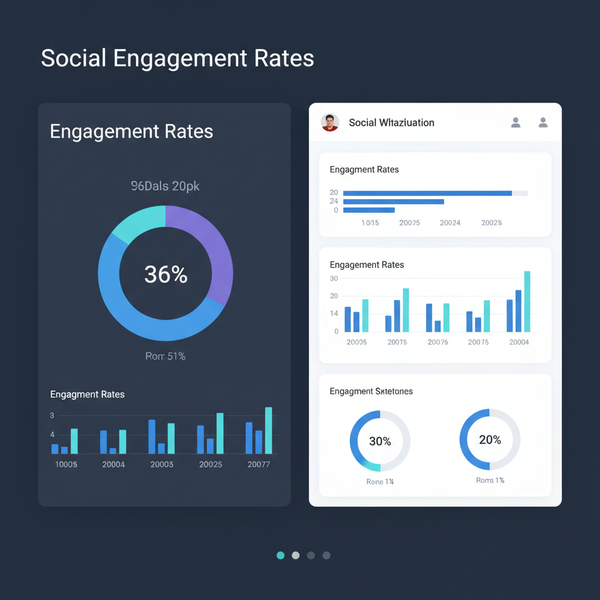
Monitoring Post Performance: Impressions, Clicks, Engagement Rate
Your post analytics reveal what resonates with your network:
- Impressions: Frequency of your content appearing in feeds.
- Clicks: Link or content clicks by viewers.
- Engagement Rate: Percentage of viewers responding through reactions, comments, or shares.
Sample Engagement Rate Formula
Engagement Rate (%) = (Total Reactions + Comments + Shares) / Impressions × 100Low engagement with high impressions suggests content misalignment; low impressions point to distribution issues.
---
Tracking Search Appearances and Keyword Optimization
Search Appearances display how often you feature in weekly LinkedIn searches.
Optimization Tips:
- Integrate strategic keywords into your headline, summary, and work history.
- Align skill listings with current industry trends.
- Increase activity through posts and comments to strengthen algorithmic visibility.
Keyword analytics help you fine-tune your profile language for discoverability.
---
Identifying Top-Performing Content Types and Formats
Analytics can pinpoint which formats generate the most interaction:
- Long-form Articles: Ideal for establishing thought leadership.
- Short Status Updates: Great for quick engagement bursts.
- Videos: Highly engaging thanks to visual storytelling.
- Image Posts: Useful for highlighting achievements or narratives.
Replicating high-performing formats can steadily grow engagement rates.
---
Adjusting Posting Schedule Based on Analytics Insights
The timing of your posts impacts reach and engagement:
- Compare morning vs. evening performance.
- Assess weekday vs. weekend trends.
- Identify specific days with the highest visibility.
If analytics show increased activity on Tuesday mornings, plan major posts for that slot.
---
Refining Headline, Summary, and Skills to Match Audience Interest
Your headline drives search visibility, while your summary conveys your professional story.
Analytics can reveal which industries and roles view your profile, guiding refinement.
Quick Wins:
- Align headline keywords with high-interest demographics.
- Update your summary with fresh, relevant accomplishments.
- Add skills consistently endorsed by existing connections.
---
Leveraging Company Page Analytics
For organization-focused growth, company page analytics track:
- Visitor demographics
- Follower growth trends
- Post engagement metrics
- Website click-through rates
These metrics enhance both corporate branding and personal positioning.
---
Setting Monthly Goals and Measuring Progress Over Time
Analytics are most effective with clear targets:
- Define Objectives: e.g., Boost profile views by 20% in one month.
- Track Weekly: Note metric shifts and test new tactics.
- Evaluate Milestones: Compare actuals against goals.
Example Tracking Table
| Month | Profile Views | Post Impressions | Search Appearances |
|---|---|---|---|
| January | 500 | 3,000 | 150 |
| February | 650 | 4,500 | 220 |
| March | 800 | 5,200 | 300 |
Tracking makes it easier to measure long-term progress.
---
Using LinkedIn’s Competitor Analysis Features
Company pages sometimes include competitive benchmarking:
- Compare follower growth curves.
- Measure engagement rates relative to peers.
- Identify posting style gaps.
This helps you adopt proven tactics from leading competitors.
---
Exporting Data for Deeper Analysis
To analyze offline:
- Go to the analytics dashboard.
- Click the Export option.
- Select a date range and download as CSV or Excel.
External tools like Excel or Google Sheets provide more advanced analytical possibilities.
---
Testing Changes and Tracking Improvement in Profile Metrics
Continual improvement relies on controlled experimentation:
- Adjust One Element: Change headline wording or post format.
- Measure Impact: Compare performance over identical periods.
- Iterate: Keep beneficial changes, discard ineffective ones.
This careful approach ensures sustainable engagement growth.
---
Final Thoughts
Mastering how to use LinkedIn Analytics to boost your profile goes beyond simply watching numbers — it’s about applying insights to grow visibility, relevance, and connection opportunities.
With consistent monitoring, smart keyword integration, and targeted posting strategies, you can elevate both your profile and professional prospects.
Start implementing these steps today, and let your analytics guide you toward a more impactful LinkedIn presence.
Ready to level up your LinkedIn strategy? Begin tracking your analytics weekly and see how small data-driven changes lead to big results.