Using Twitter Analytical Tools to Boost Audience Growth
Learn how to use Twitter analytics tools to track key metrics, refine content strategies, and increase audience growth through data-driven decisions.

Using Twitter Analytical Tools to Boost Audience Growth
Twitter remains one of the most dynamic social media platforms for personal brands, businesses, and content creators. However, sustainable success on Twitter comes from data-driven decision-making, not random posting. This is where Twitter analytical tools play a vital role — enabling you to understand audience behavior, refine strategies, and ultimately boost audience growth by focusing on what works.
In this guide, you’ll learn how to effectively leverage Twitter’s native analytics dashboard, identify critical metrics, refine tweet formats, experiment with trends, and integrate third-party tools for deeper insights.

---
Understanding the Basics of the Twitter Analytics Dashboard
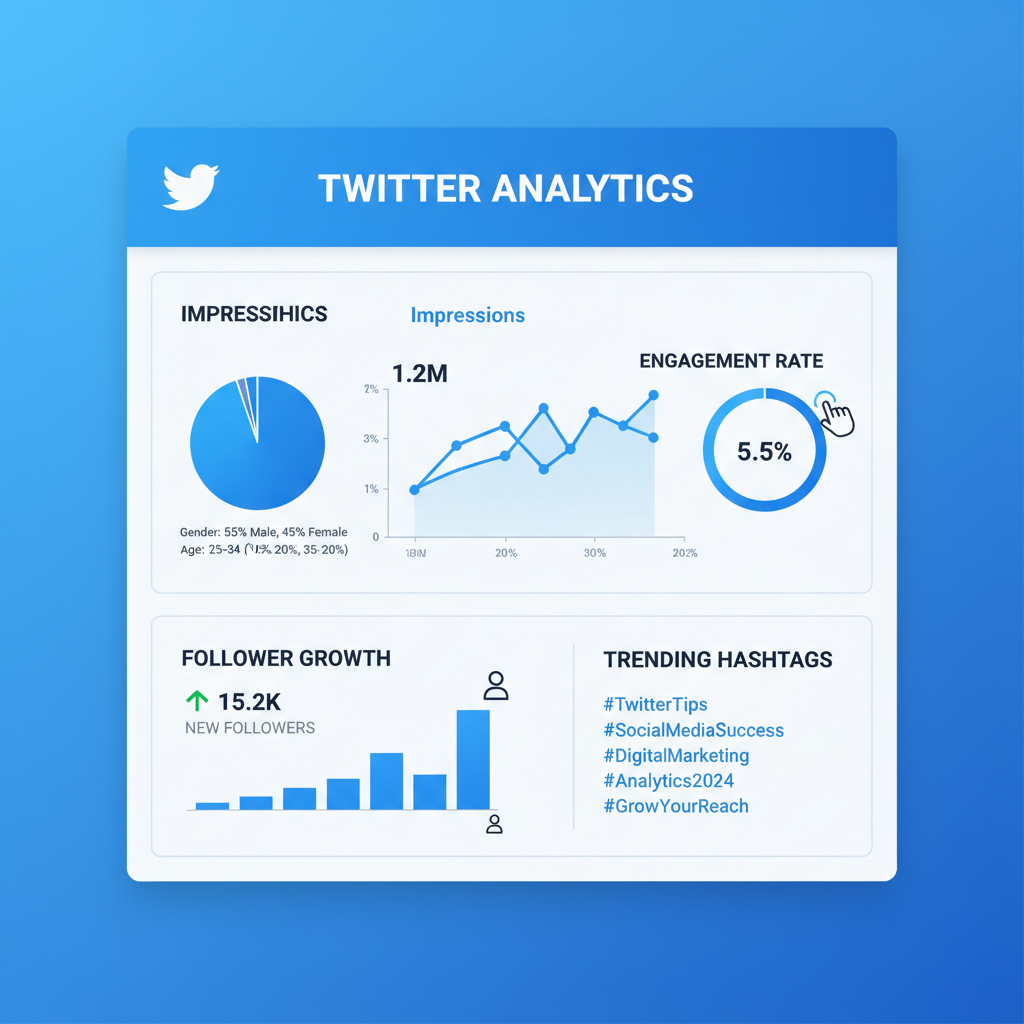
Twitter Analytics is accessible from your account by navigating to More > Analytics. The dashboard provides a clean, visual breakdown of your account activity, including tweet impressions, engagement metrics, and follower statistics.
Key features include:
- Overview of tweet performance over time
- Audience demographic snapshots
- Engagement measurements
- Monthly performance summaries
The dashboard serves as a central hub for monitoring how your content is received and how your audience behavior changes month to month.
---
Identifying Key Metrics: Impressions, Engagement Rate, Follower Growth
The three primary metrics to monitor are:
- Impressions – Total number of times users saw your tweets.
- Engagement Rate – Percentage calculated from interactions (likes, retweets, replies, link clicks) divided by impressions.
- Follower Growth – How your audience size changes over time.
| Metric | Definition | Why It Matters |
|---|---|---|
| Impressions | Number of times tweets appear on user screens | Measures reach; helps gauge visibility |
| Engagement Rate | Interactions ÷ Impressions | Shows how compelling tweets are |
| Follower Growth | Net gain or loss in followers | Indicates overall brand momentum |
Tracking these metrics enables a healthy balance between reach and interaction quality. A tweet may do well in impressions but perform poorly in engagement rate — often hinting at a content mismatch.
---
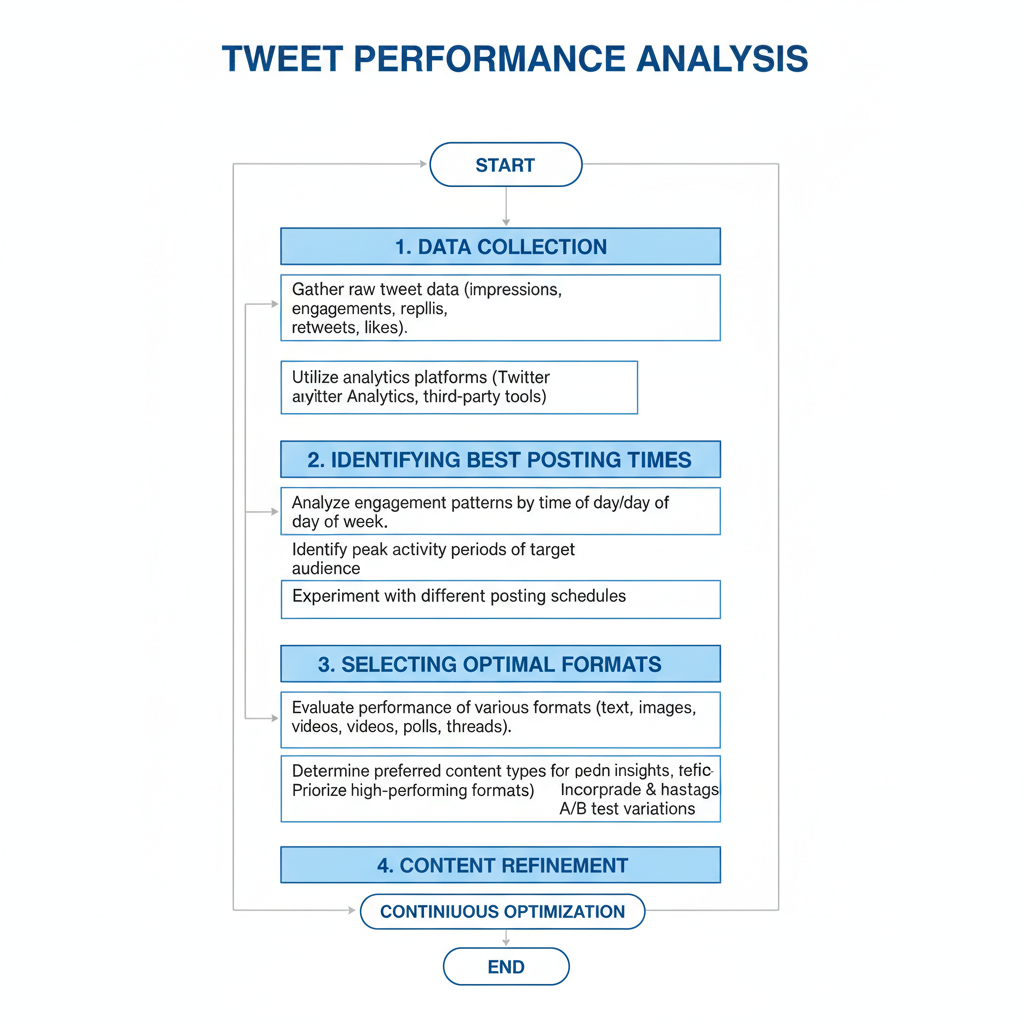
Analyzing Tweet Performance: Best Times and Formats for Posting
Finding the best posting time is crucial. Analytics can reveal when your followers are most active.
Examples:
- Morning posts often attract professionals during commute hours.
- Evening posts resonate with casual scrollers.
- Weekday vs. weekend patterns can vary by niche.
Review top-performing tweets and note their posting time, format, and tone. Use comparative observation:
Example:
Tweet A (Tue, 9 AM) – 2.5% Engagement
Tweet B (Sat, 6 PM) – 1.2% Engagement
This data will help solidify your posting schedule for maximum impact.
---
Tracking Audience Demographics and Interests
Twitter Analytics provides demographic segments such as:
- Location
- Gender
- Language
- Interests
For global brands, knowing your top geographies allows strategic content localization. For instance, timing tweets for peak hours in your primary region can sharply increase engagement.
Pro Tip: Use interest data to align topics with audience preferences — if your followers enjoy tech news, weave trending tech hashtags into your brand message.
---
Using Analytics to Refine Content Strategy
All collected data should feed directly back into your content strategy. If engagement rate dips despite high impressions, consider:
- Adjusting tone and CTAs
- Experimenting with tweet length
- Adding media for stronger visual appeal
By mapping metrics to content changes, you create a smart, iterative process:
- Measure current performance.
- Implement changes.
- Re-measure and compare results.
---
Experimenting with Tweet Formats
Variety keeps your feed fresh. Test multiple formats:
- Text-only tweets for concise updates.
- Images that draw attention in busy timelines.
- Videos for storytelling and product demos.
- Polls for interactive audience engagement.
Analytics will reveal which formats consistently outperform. Images may generate higher impressions, while polls often win on engagement rate.
---
Monitoring Hashtag Performance and Trend Participation
Hashtags can dramatically expand your tweet reach, but not all hashtags carry equal value.
Steps:
- Measure engagement from tweets with specific hashtags.
- Compare with tweets without hashtags.
- Identify trending hashtags relevant to your audience.
Trend participation boosts exposure, particularly when well-timed. Avoid off-topic trends, as they dilute your brand voice.
---
Leveraging Third-Party Analytical Tools for Deeper Insights
Native Twitter Analytics has limits. Consider third-party tools for:
- Advanced sentiment analysis
- Competitor benchmarking
- Automated reporting and scheduling
- Keyword tracking across platforms
Popular solutions include Sprout Social, Hootsuite, and Brandwatch. Many combine Twitter data with other social channel analytics for a holistic view.
---
Setting Measurable Goals Based on Data Trends
Analytics empower you to set realistic targets:
- Increase engagement rate from 2% to 3% within 60 days.
- Grow followers by 10% over three months.
- Boost average impressions by 25% month-over-month.
Goals should be SMART: Specific, Measurable, Achievable, Relevant, Time-bound.
---
Creating Monthly Performance Reports to Track Progress
Monthly reports consolidate your learnings and make them easy to share.
| Metric | Month 1 | Month 2 | Change (%) |
|---|---|---|---|
| Impressions | 50,000 | 62,000 | +24 |
| Engagement Rate | 2.1% | 2.8% | +33 |
| Follower Growth | +300 | +450 | +50 |
Visual graphs make spotting trends easier for stakeholders.
---
Adjusting Posting Schedule and Content Mix Based on Analytics Feedback
Regularly reviewing your analytics lets you:
- Adjust posting times to match peak activity.
- Balance content formats (text, media, polls).
- Target trending topics backed by audience interest data.
Example: If evening posts consistently underperform, shift them to the morning without altering total frequency.
---
Avoiding Common Mistakes in Interpreting Data
Analytics are powerful — but misinterpretation can cost you. Be cautious about:
- Correlation vs. causation – a spike after a format change isn’t always caused by that change.
- Short-term bias – external events may create temporary spikes.
- Ignoring context – seasonal trends or platform algorithm changes can influence metrics.
Analyze patterns over longer periods to ensure accuracy.
---
Conclusion
Mastering Twitter analytical tools transforms guesswork into informed strategy. By learning the dashboard functions, tracking vital metrics, experimenting with tweet formats, monitoring hashtag performance, leveraging advanced third-party tools, and continually refining your approach based on reliable data, you can significantly accelerate audience growth.
Commit to consistent reviews, avoid common pitfalls in data interpretation, and ensure your goals align with audience behavior. Over time, this disciplined and analytical approach will strengthen your presence, extend your reach, and nurture meaningful community connections.
Start tracking and refining your Twitter strategy today to see measurable growth in both engagement and followers.