Using Twitter Analytics to Increase Audience Growth
Learn how to use Twitter Analytics to analyze engagement, track follower trends, and refine content strategy for faster and targeted audience growth.
Introduction to Twitter Analytics Dashboard for Audience Growth
Leveraging Twitter Analytics is essential for understanding and optimizing your social media performance. This free tool from Twitter provides clear insights into how your tweets perform, who your audience is, and where growth opportunities lie. By mastering the Twitter Analytics dashboard, you can make data-driven decisions that boost engagement, increase impressions, and grow your audience.
---
Understanding the Twitter Analytics Dashboard
Twitter Analytics offers a powerful set of tools for measuring your account's activity, audience engagement, and growth trends. Becoming familiar with the dashboard is the first step towards using Twitter analyticsa effectively for audience growth.

When you open Twitter Analytics, you’ll see an overview that typically includes:
- Tweets: The number of tweets you have posted within a selected time frame.
- Tweet Impressions: How many times users have seen your tweets.
- Profile Visits: The number of times users visited your Twitter profile.
- Mentions: How many times other users have mentioned you.
- Followers: The net change in follower count.
Key Terminology:
- Impressions: The total number of times a tweet was displayed to users.
- Engagements: Total interactions with a tweet (likes, retweets, replies, link clicks).
- Engagement Rate: Engagements divided by impressions, expressed as a percentage.
---
Analyzing Impressions and Engagement Rate
Impressions and engagement rate are at the core of understanding tweet performance.
Impressions tell you how far your tweet traveled in terms of visibility. Engagement rate reveals how compelling your content is to the audience exposed to it.
Steps to Use This Data:
- Identify High-Impression Tweets: They indicate strong reach—investigate why they were widely seen.
- Compare Engagement Rates: A tweet with fewer impressions but high engagement might be inherently more appealing to a niche audience.
- Spot Trends: If certain topics consistently have higher engagement rates, they may be ideal for audience building.
---
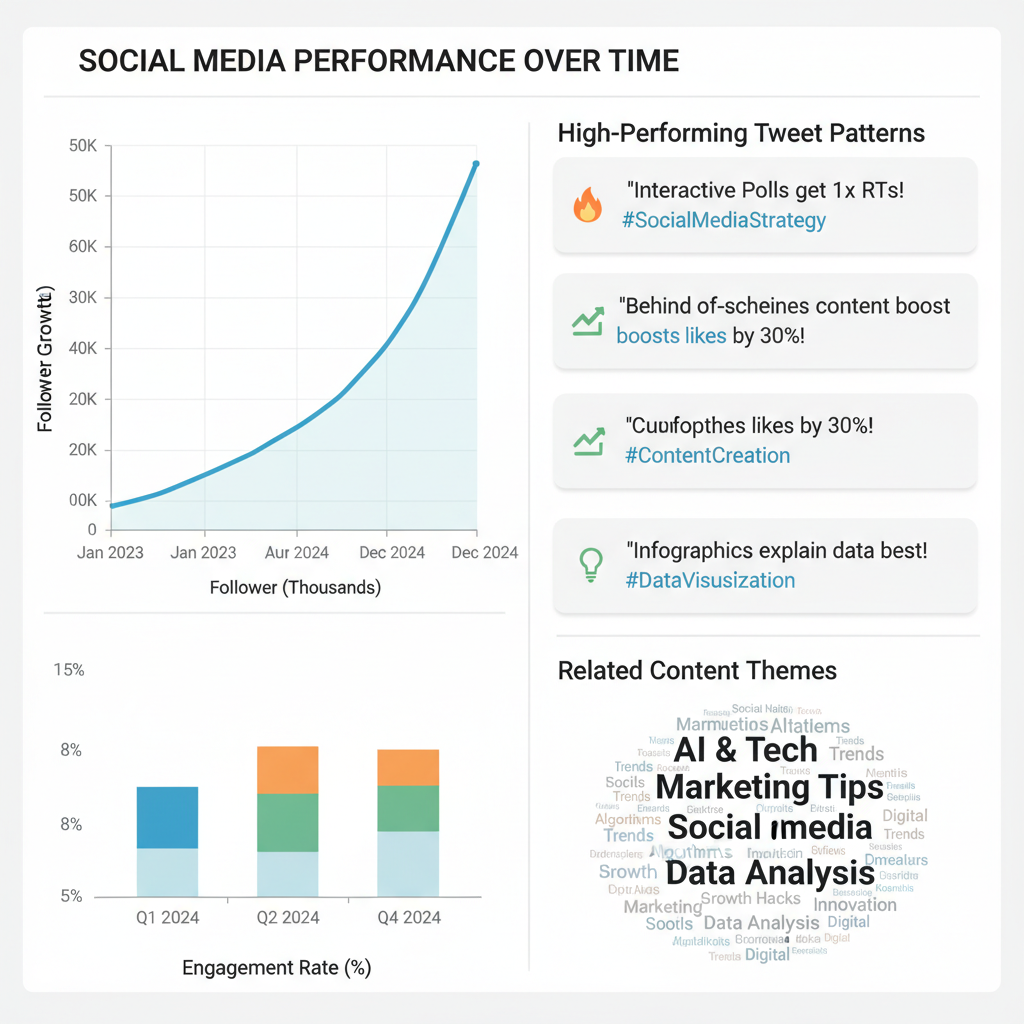
Evaluating Follower Growth Trends and Demographics
Follower counts are not just about numbers—they tell the story of your community's expansion and composition.
Follower Growth Trends can be plotted over weeks or months to understand which campaigns or tweet types trigger spikes. The demographics section includes:
| Demographic Data | Importance |
|---|---|
| Location | Helps tailor tweets to regional events or time zones. |
| Gender | Guides tone and topic selections. |
| Language | Supports multilingual content strategies. |
| Interests | Allows targeting aligned with followers’ hobbies or professional fields. |
By aligning your content to match follower demographics, you increase relevance and engagement.
---
Tracking Top-Performing Tweets and Identifying Content Patterns
The “Top Tweets” section in Twitter Analytics lists your highest-impression tweets per month.
How to Identify Patterns:
- Group tweets by topic and compare reach and engagement.
- Note any recurring formats (e.g., polls or image-based tweets) showing strong performance.
- Compare posting times of top tweets to find ideal publishing slots.
---
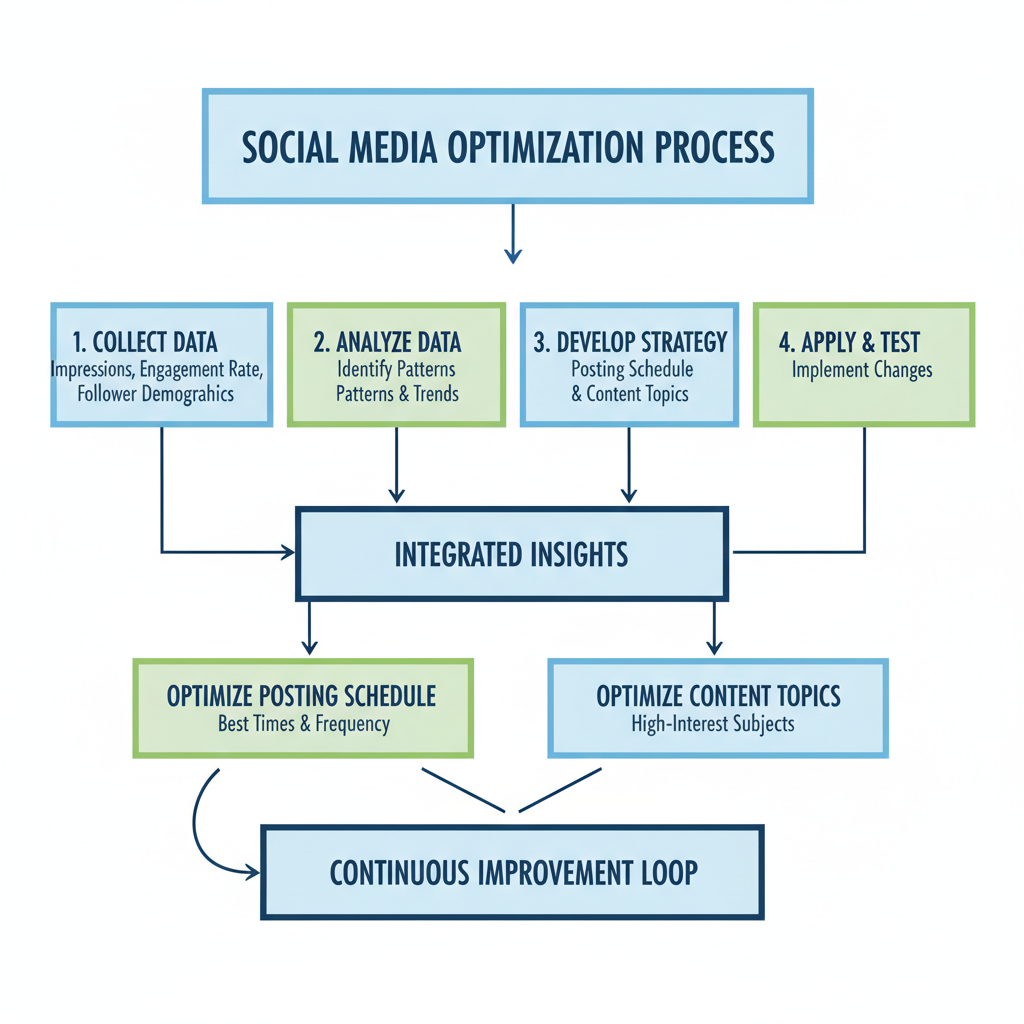
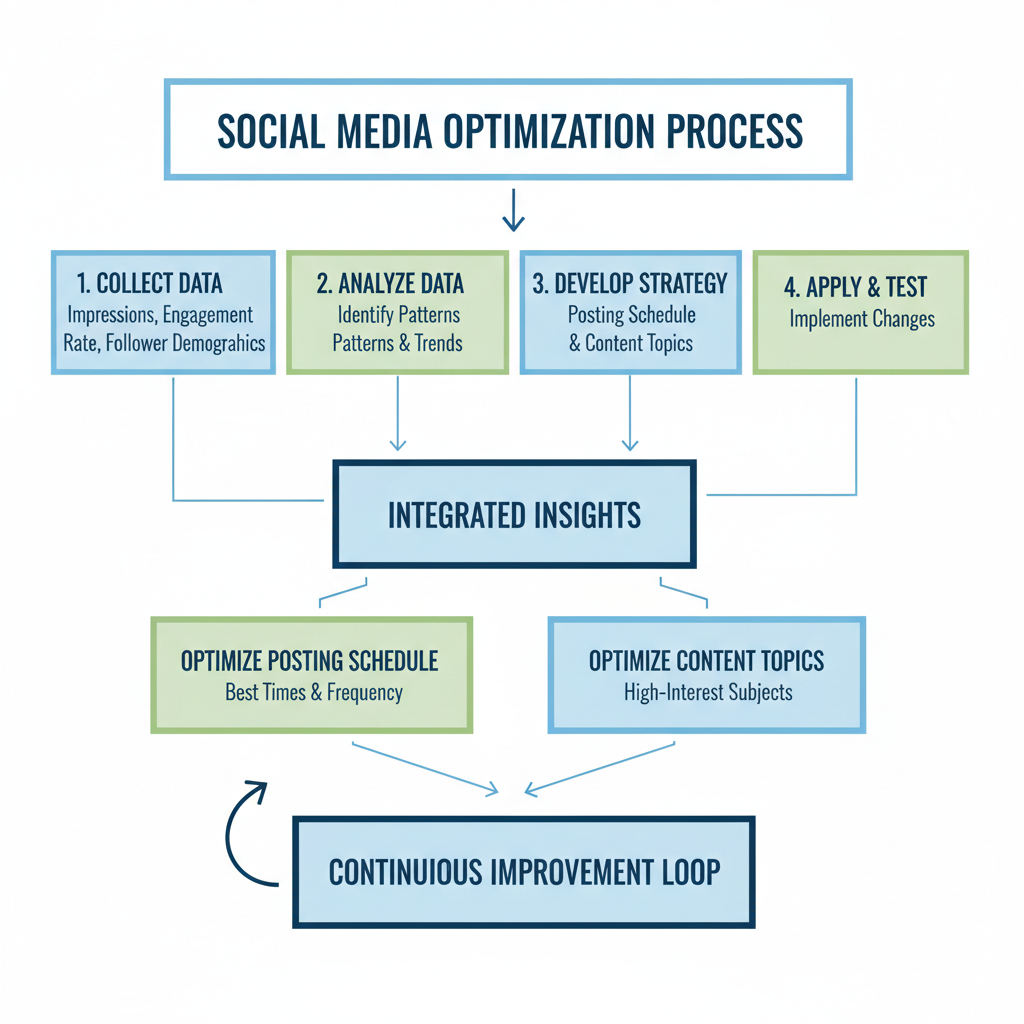
Using Audience Insights to Refine Posting Schedule and Topics
Audience insights help streamline your content calendar. If analytics reveal most followers are active around specific hours, adjust your schedule accordingly.
Action Plan:
- Use data about when followers engage most.
- Cross-reference audience interests with trending hashtags.
- Prioritize content that historically yields higher engagement rates.
By connecting insights from Twitter analyticsa with a consistent posting rhythm, you maximize visibility and growth potential.
---
Measuring Link Clicks, Retweets, and Replies for Content Impact
Beyond likes and impressions, deeper metrics like link clicks, retweets, and replies measure the tangible impact of your tweets:
- Link Clicks: Indicate direct traffic driven to your website or landing pages.
- Retweets: Expand reach beyond your followers.
- Replies: Reflect conversation and community engagement.
These metrics often relate more directly to business or campaign goals than vanity metrics (raw likes or follower counts).
---
Experimenting with Different Media Formats
Media format experimentation is a growth lever. Tweets with media—images, videos, GIFs—often show boosted engagement.
Formats to Test:
- Images: High-quality visuals relevant to your message.
- Videos: Short informative or entertaining clips.
- GIFs: Humorous or explanatory motion snippets.
- Polls: Encourage quick audience interaction.
Track performance by media type in Twitter Analytics, then focus on those formats driving better engagement.
---
Conducting Monthly Analytics Reviews and Setting Data-Driven Goals
Regular reviews create a feedback loop for improvement. Each month:
- Export Twitter Analytics data.
- Compare metrics against previous months.
- Identify which tweets or campaigns yielded growth.
Set goals based on data:
- Increase engagement rate by a specific percentage.
- Boost impressions via targeted hashtag campaigns.
- Grow followers within targeted demographic segments.
---
Integrating Twitter Analytics Data with Other Social Media Tools
Integrating Twitter analyticsa with platforms like Google Data Studio, Sprout Social, or Hootsuite can give broader visibility across social channels.
Benefits:
- Unified dashboard for multiple social networks.
- Ability to correlate Twitter performance with Facebook, Instagram, or LinkedIn results.
- Comprehensive content strategy alignment.
---
Avoiding Vanity Metrics—Focus on Actionable Data
Vanity metrics like total likes or follower counts are easy to track but may not translate to meaningful growth.
Instead, Prioritize:
- Engagement Rate: Shows interest level, not just visibility.
- Follower Demographics Match: Ensures you attract the target audience.
- Conversions from Twitter: Link clicks, sign-ups, sales.
Focusing on actionable data ensures you design strategies that truly enhance your audience size and brand impact.
---
Summary & Next Steps
Mastering the Twitter Analytics dashboard allows brands and individuals to transform raw data into actionable audience growth strategies. From analyzing impressions and engagement rates, to refining posting schedules, to experimenting with media, each insight builds toward measurable improvement.
Start by reviewing your dashboard today, set baseline metrics, and implement one data-driven change per week. Over time, those incremental adjustments will compound into significant growth. Explore Twitter Analytics now and unlock its full potential for audience engagement.