How to View Analytics on TikTok and Understand Your Data
Learn how to access TikTok analytics, read key metrics, and use data-driven insights to optimize your content strategy and grow your audience.
How to View Analytics on TikTok and Understand Your Data
TikTok has quickly become a dominant platform for creators, brands, and marketers. If you want to grow your presence, knowing how to view analytics on TikTok is essential for making data-driven decisions. In this comprehensive guide, you'll learn how to access TikTok analytics, read key metrics, and translate those insights into a winning content strategy.

---
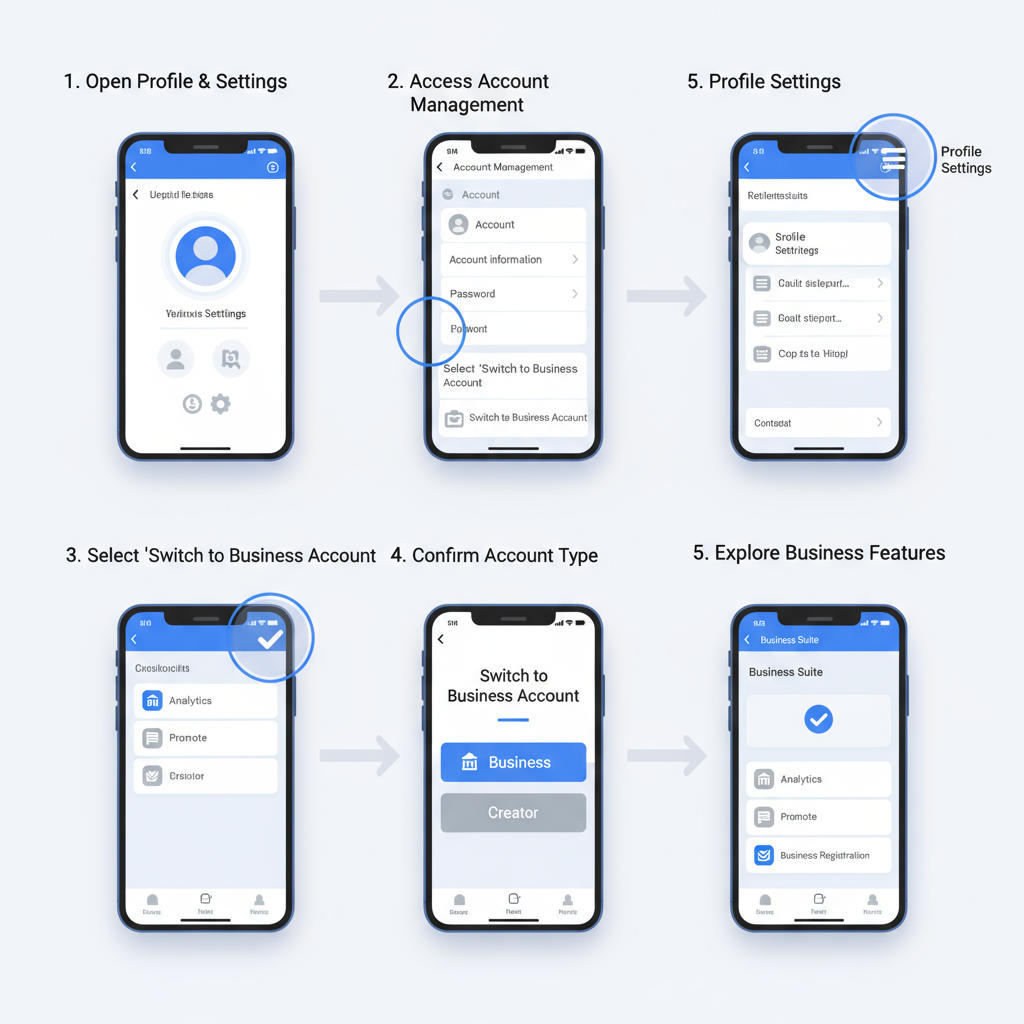
Switch to a TikTok Business or Creator Account
TikTok analytics are only available for Business and Creator accounts. If you’re currently using a personal account, you’ll need to switch:
- Open Your Profile
- Tap the profile icon at the bottom right corner of the TikTok app.
- Access Settings
- Tap the hamburger menu (☰) in the upper right, then choose Settings and Privacy.
- Manage Account
- Select Manage Account from the menu.
- Switch Account Type
- Tap Switch to Business Account or Switch to Creator Account and follow the prompts.
Switching is free, and you can revert at any time, but analytics will be hidden on a personal profile.
---
Navigate to Analytics from Profile Settings
Once you have a Business or Creator account:
- Go to your profile page
- Tap the hamburger menu > Creator Tools > Analytics
Some users will find Analytics in the Business Suite tab, depending on the app version.
---
Explore the TikTok Analytics Dashboard
The TikTok Analytics dashboard is organized into four key tabs for quick navigation:
- Overview – Snapshot of account performance
- Content – Insights into individual videos
- Followers – Demographic and behavior data
- LIVE – Stats for your live-stream sessions
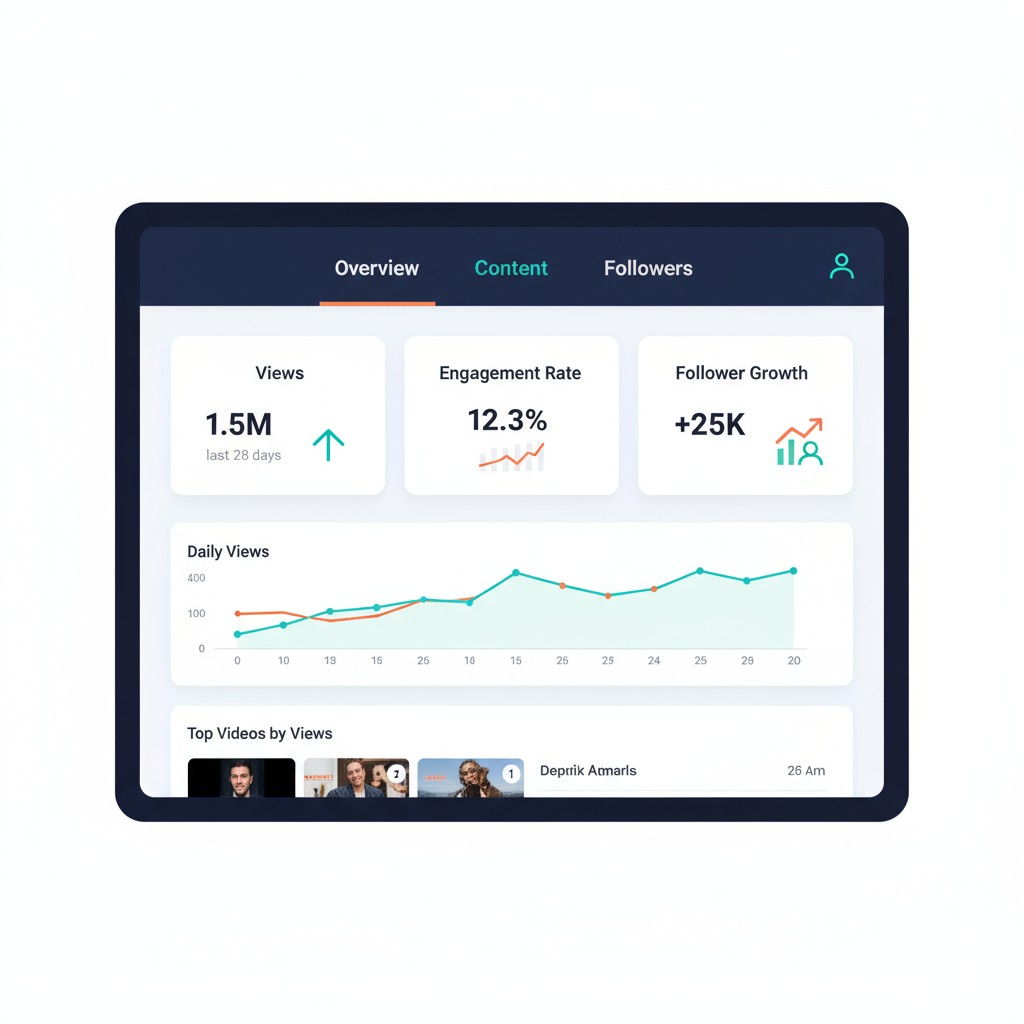
Visual charts and trend lines help make complex data easier to understand and act upon.
---
Overview Tab: Profile-Level Performance
The Overview tab summarizes performance over a date range of your choice.
Core Metrics:
- Video Views – Total plays across all videos
- Followers – Current number and changes within the range
- Profile Views – How many times your profile was visited
The interactive graph allows day-by-day or week-by-week comparisons.
---
Content Tab: Video-Level Insights
The Content tab lets you review the performance of your most recent videos.
Metrics to Monitor:
- Video Reach – Unique viewers reached
- Engagement – Likes, comments, shares, and saves
- Average Watch Time – How long viewers watch before leaving
- Traffic Sources – Where viewers found your content (For You page, profile, hashtags, sound pages)
By studying these metrics, you can identify popular video lengths, trending topics, and effective post formats.
---
Followers Tab: Know Your Audience
The Followers tab offers a deeper look at your audience composition.
You’ll find data on:
- Gender Split
- Top Territories – Where your audience is located
- Activity Times – When followers are most engaged
- Interests & Other Watched Videos – Categories and creators your audience likes
This audience intel allows you to align your content with the right timing and tone.
---
Live Tab: Evaluate Live Stream Performance
If you host live sessions, use the LIVE tab for real-time feedback on:
- Total views per live session
- Followers gained while live
- Stream duration and schedule
- Diamonds earned (TikTok’s virtual gifts)
Review patterns to choose ideal time slots and content formats for live events.
---
Customize Date Ranges for Targeted Analysis
TikTok allows you to filter analytics by common or custom ranges:
- Last 7 days
- Last 28 days
- Last 60 days
- Custom (up to 60 days per search)
Pro Tip: Analyzing the same ranges consistently (e.g., comparing weekly performance) helps filter out seasonal spikes.
---
Measure Watch Time and Retention
TikTok’s algorithm values watch time heavily. Three watch-time metrics matter most:
- Average Watch Time – Mean seconds watched per view
- Average Percentage Watched – Portion of the video completed
- Retention Curves – Identify drop-off points
If most viewers leave early, adjust your hook, editing pace, or length.
---
Track Trends and Growth Over Time
Export your analytics regularly to spot growth patterns:
| Metric | Week 1 | Week 2 | % Change |
|---|---|---|---|
| Followers | 2,500 | 2,750 | +10% |
| Video Views | 15,000 | 20,000 | +33% |
| Profile Views | 1,000 | 1,200 | +20% |
Percentage changes help distinguish spikes from consistent growth.
---
Export and Save TikTok Analytics Data
To export analytics (desktop required):
- Log in to TikTok via desktop browser
- Navigate to Creator Tools > Analytics
- Set your desired date range
- Click Export Data
The CSV file can be opened in Excel or Google Sheets for charts and deeper comparisons.
---
Apply Analytics to Your Posting Strategy
Turn insights into actions:
- Post When Followers Are Online – Maximize reach by posting at peak activity times.
- Repeat Top Performers – Identify trends in high-performing videos and replicate the structure.
- A/B Test Content – Change one element per test (e.g., hook, caption style) to isolate impact.
- Engage Core Demographics – Lean into the content themes your primary audience responds to.
- Boost Retention – Use patterns and pacing to keep viewers watching to the end.
---
Avoid Common TikTok Analytics Mistakes
Steer clear of:
- Obsessing Over Views Alone – Engagement matters more for long-term visibility.
- Neglecting Retention Rates – Early drop-offs can limit distribution.
- Infrequent Checks – Consistent monitoring supports gradual optimization.
- Reacting to One-Off Spikes – Wait for trend confirmation before changing course.

---
Supplement with Third-Party Analytics Tools
For deeper insights, some creators add third-party platforms to their toolkit.
Advantages:
- Multi-platform analytics integration
- Advanced reporting features
- Sentiment analysis and trend mapping
Drawbacks:
- Paid plans required for full access
- Possible data privacy considerations
- Data may differ from TikTok’s native metrics
Popular options: Analisa.io, Pentos, TrendTok.
---
Summary and Next Steps
Understanding how to view analytics on TikTok empowers you to fine-tune your content, target the right audience, and maximize performance over time. By consistently tracking metrics, testing variables, and acting on trends, you can achieve sustainable growth—whether your goal is brand exposure, sales, or viral reach.
Start analyzing your TikTok data today and let your next post outperform the last.