View and Analyze Your Twitter Stats Summary
Learn how to access and interpret your Twitter stats summary to optimize reach, engagement, and follower growth with actionable insights.
A Twitter stats summary is the fastest way to understand how your content performs on Twitter, helping you optimize reach, engagement, and follower growth without guesswork.
Introduction to Twitter Analytics and Stats Summary
Twitter has evolved far beyond a simple microblogging platform—it’s now a powerful channel for brands, influencers, and everyday users to engage audiences. To maximize your impact, you need to understand the performance of your activity on the platform. That’s where the Twitter stats summary comes in.
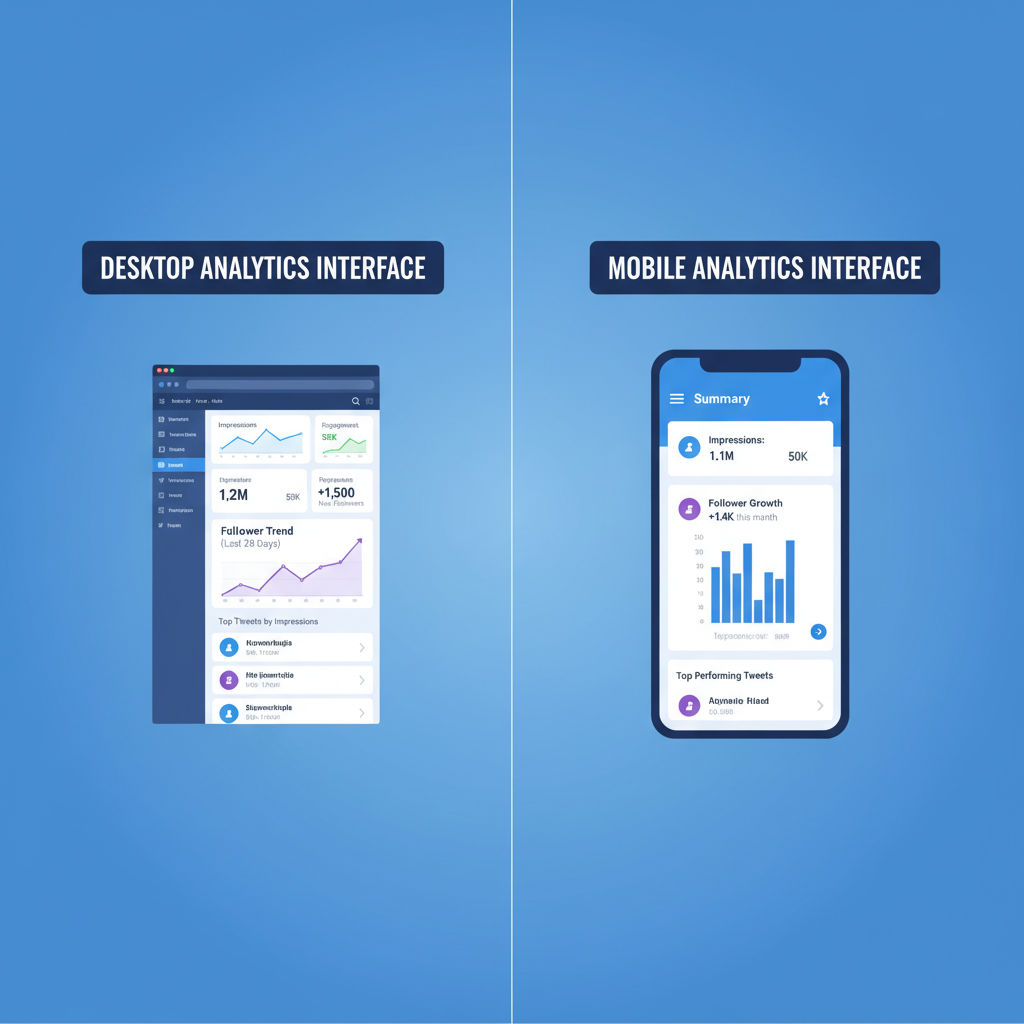
A Twitter stats summary gives you a snapshot of your account’s performance. From impressions and engagements to follower growth, these metrics help you make smarter, more informed posting decisions.

In this guide, we’ll explore how to access your stats, understand metrics, and leverage insights for better results.
---
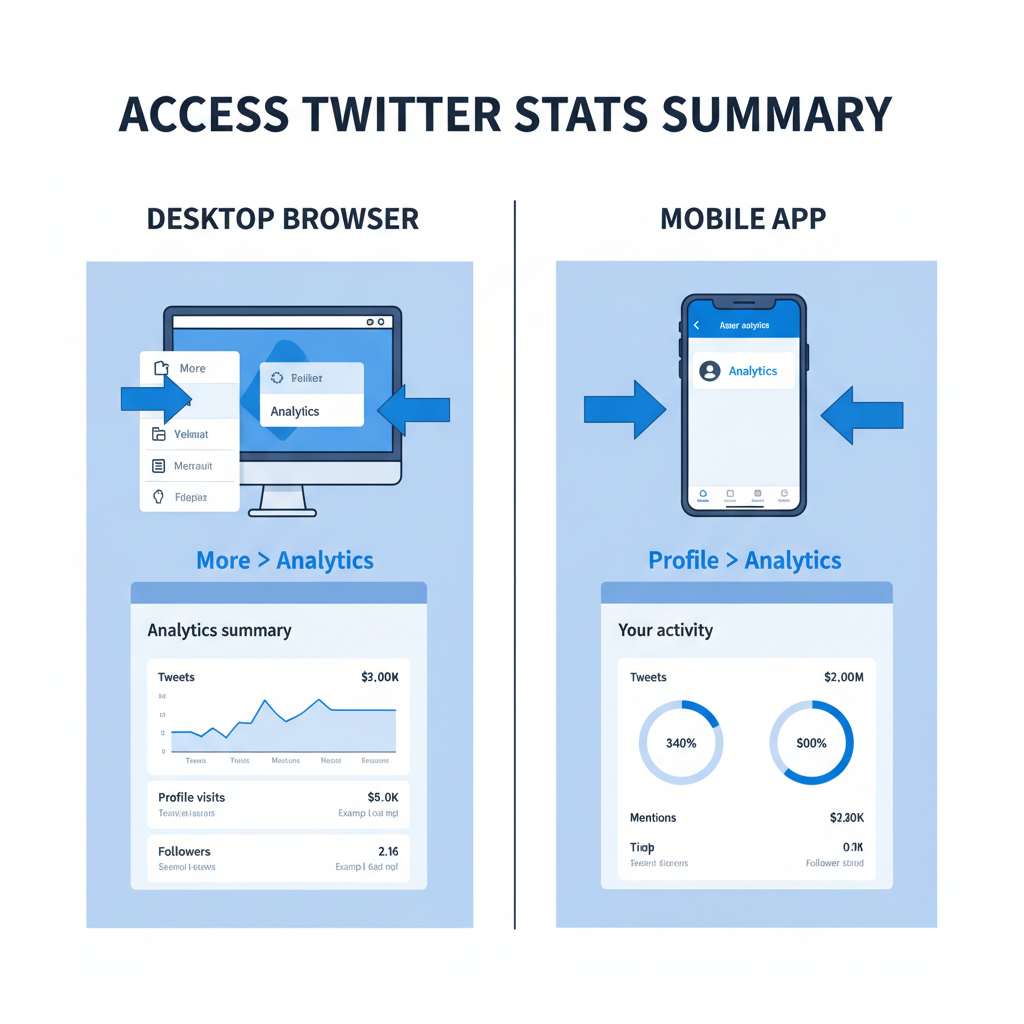
How to Access Your Twitter Stats (Desktop & Mobile)
Accessing your Twitter stats summary is simple, but the steps vary slightly depending on your device.
On Desktop (Browser)
- Log in to your account.
- Click “More” in the main menu.
- Select “Analytics.”
- You’ll see a 28-day summary along with tweet-by-tweet data.
On Mobile (Twitter App)
- Open the app and go to your profile.
- Tap on any tweet.
- Select “View tweet activity” for detailed metrics.
For mobile users, Twitter doesn’t display the full account analytics dashboard—but you can still see tweet-level data.
---
Breakdown of Key Metrics
Understanding each metric in your Twitter stats summary is crucial. Here’s a list of the most important ones:
| Metric | Definition | Why It Matters |
|---|---|---|
| Impressions | Number of times your tweet appeared on someone’s screen | High impressions indicate wide reach |
| Engagements | Total actions taken on the tweet (likes, retweets, clicks) | Shows how interactive your audience is |
| Engagement Rate | Engagements divided by impressions (%), showing interaction per view | Helps compare performance across varying reach |
| Profile Visits | People clicking through to your profile from the tweet | Indicates potential new follower interest |
| Mentions | Times your username is referenced by others | Measures visibility and conversation |
| Followers Gained | Net increase in followers during the period | Reflects audience growth |
| Link Clicks | Number of clicks on URLs within your tweet | Signals content relevance and conversion potential |
| Detail Expands | Times users expanded the tweet to see more | Indicates curiosity and contextual interest |
| Video Views | Plays of embedded video content | Helps evaluate multimedia performance |
---
Understanding Tweet-by-Tweet Analytics
Beyond the account-wide summary, Twitter lets you drill down into individual tweet performance.
How to Read Tweet-by-Tweet Data
- Impressions show visibility per tweet.
- Detail Expands reveal audience curiosity about context.
- Link Clicks indicate conversion potential.
- Like-to-Retweet Ratio can suggest content flavor preference (informational vs. shareable).
- Replies reflect conversation depth and community building.
Tracking tweet-level data helps you identify what works best on a micro-scale.
---
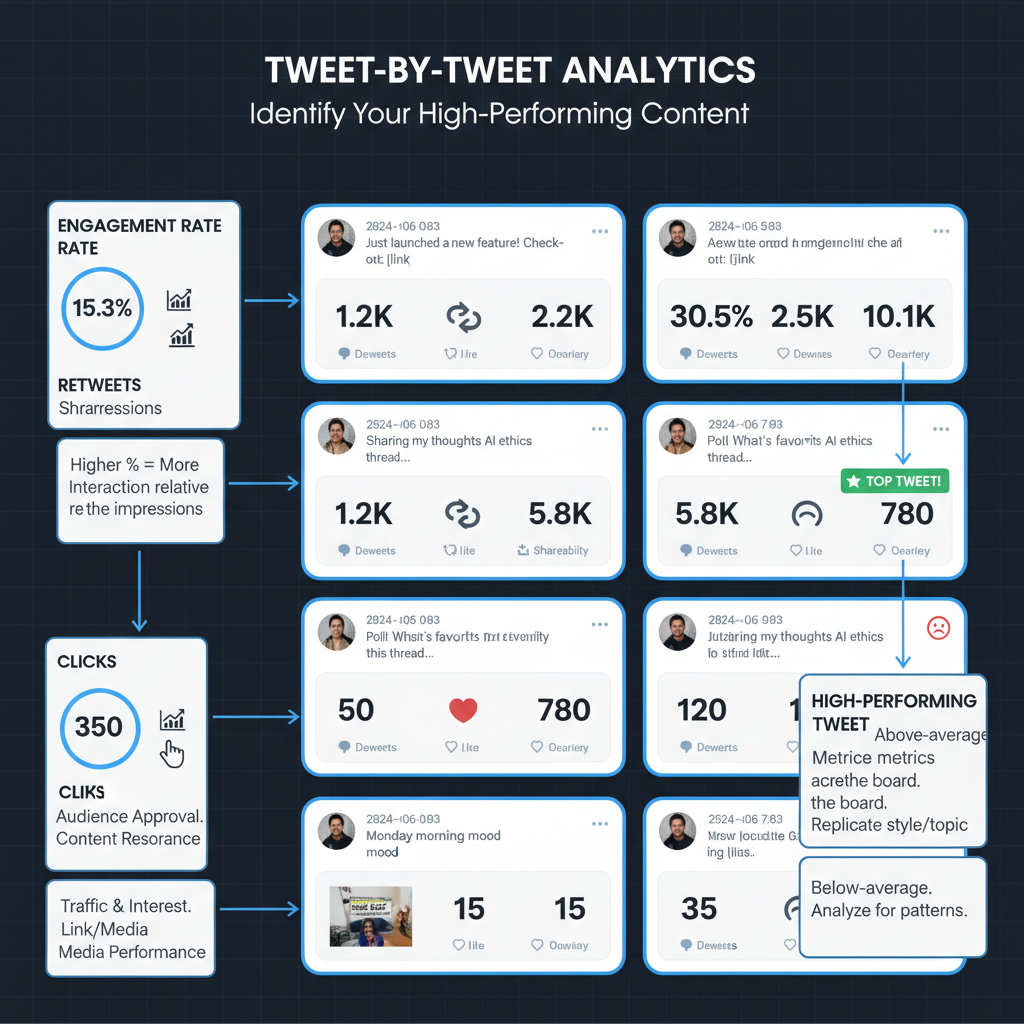
Using Stats to Identify High-Performing Content
Not all tweets are equal—some resonate and spread rapidly, while others fizzle. To find high-performing content:
- Sort tweets by engagement rate.
- Check which visuals or topics consistently get retweeted.
- Compare post timing for peak interaction hours.
- Note patterns in hashtags and calls to action that drive clicks.
If a tweet’s engagement rate is twice your average, analyze why: was it the wording, topic, hashtag usage, or timing?
Pro Tips for Content Optimization
- Pair strong headlines with clear visuals and concise captions.
- Use one or two relevant hashtags to improve discoverability without clutter.
- Add a simple CTA (e.g., “Read more,” “Tell us your thoughts”) to drive interaction.
---
Tracking Follower Growth Trends Over Time
Follower growth isn’t just about numbers—it’s about consistency. Twitter’s analytics dashboard shows follower count changes over time.
Tips for Tracking Trends
- Note sudden spikes and cross-reference with tweet history.
- Identify slow periods; test new content types to re-engage audiences.
- Use spreadsheets to log weekly follower changes for deeper trend analysis.
- Compare growth during campaigns vs. organic periods to validate impact.
Seeing growth aligned with targeted campaigns can validate your strategy.
---
Analyzing Audience Demographics and Interests
Twitter provides demographic data under the “Audience” section, revealing:
- Geographic location
- Gender distribution
- Language preference
- Top interests
Benefits of Audience Demographics
- Tailor tweets to specific languages or cultural contexts.
- Focus topics on your audience’s primary interests.
- Adjust posting times to align with audience time zones.
- Align brand tone and examples with audience segments for higher relevance.
Demographics help refine your targeting, boosting both engagement and relevance.
---
How to Apply Insights to Improve Tweet Strategy
Once you understand your Twitter stats summary:
- Refine Content Themes – Focus on topics that attract higher engagement and align with audience interests.
- Optimize Posting Schedule – Post when your audience is most active.
- Test and Iterate – Experiment with formats (text, polls, video) and compare metrics.
- Leverage High-Performers – Repurpose successful tweets for other platforms.
- Track Outcomes – Use UTM parameters on links to connect tweet clicks to on-site behavior.
---
Common Mistakes in Interpreting Twitter Data
While data is powerful, misinterpretation can lead to bad decisions.
Common Pitfalls
- Overvaluing Impressions – High reach doesn’t always mean high engagement.
- Ignoring Context – External events can skew metrics temporarily.
- Focusing on Vanity Metrics – Followers alone don’t signify influence; engagement matters more.
- Neglecting Time Frames – Comparing different date ranges without context can mislead.
- Overlooking Content Mix – Relying on one format can cap reach and engagement.
---
Recommended Tools for Deeper Twitter Analytics
Twitter’s native analytics are just the start. For deeper insights, try:
- TweetDeck – Advanced scheduling and monitoring.
- Hootsuite – Cross-platform analytics with tweet performance tracking.
- Sprout Social – Detailed audience breakdowns and reporting.
- Buffer Analyze – Focused content strategy insights.
These tools provide extended data retention and advanced filtering capabilities beyond the built-in dashboard.
---
Case Study: Optimizing Tweet Frequency Using Stats Summary
Let’s consider an example:
Scenario
A small digital agency wants to increase engagement without spamming followers.
Approach
- Analyze Twitter stats summary for a month.
- Identify days with highest engagement rates.
- Test increasing tweet volume on high-performing days.
- Reduce tweeting on low-engagement days.
Results
After four weeks, engagement per tweet increased by 30%, follower growth rose by 12%, and unfollow rates decreased. The agency learned that quality tweets at strategic times outperform high-volume posting.
---
Frequently Asked Questions
What is included in a Twitter stats summary?
A Twitter stats summary covers high-level metrics such as impressions, engagements, engagement rate, profile visits, mentions, and follower growth, plus access to tweet-by-tweet analytics.
How often should I review my Twitter stats summary?
Weekly reviews help you iterate quickly, while monthly reviews reveal bigger trends, seasonality, and campaign impact.
Can I export my Twitter stats summary data?
Yes. On desktop, use the analytics dashboard to export CSVs for tweets and account data, then analyze in a spreadsheet or BI tool.
What’s a good engagement rate on Twitter?
Benchmarks vary by industry and audience size, but aim to improve your own average over time. Use engagement rate to compare performance across tweets with different reach.
---
Conclusion: Make Data-Driven Decisions with Your Twitter Stats Summary
Your Twitter stats summary is a gateway to smarter social media management. By understanding metrics, tracking trends, and applying insights, you can evolve your tweet strategy to boost engagement, grow followers, and reach the right audience.
Commit to reviewing your stats regularly, experiment with content formats and timing, and double down on what works. Start analyzing your Twitter stats summary today to refine your strategy and accelerate growth.