Best Tweet Rate for Twitter Growth and Engagement
Discover the optimal tweet rate to boost reach and engagement, with frequency ranges by account size and niche, plus algorithm insights and pacing tips.
Looking for the best tweet rate to grow on X (formerly Twitter)? This guide explains how posting frequency influences reach, engagement, and follower growth—and how to set an optimal tweet cadence you can sustain without burning out.
Best Tweet Rate for Twitter Growth and Engagement
If you’ve ever wondered how often you should post on X (formerly Twitter), you’re thinking about tweet rate. Getting tweet rate right can be the difference between steady follower growth and erratic engagement. Too few posts, and you disappear from timelines. Too many, and you risk fatigue and muted followers. This guide explains how tweet rate affects reach, how the algorithm weighs frequency, and how to find your optimal cadence without burning out.

What Is Tweet Rate and Why It Matters
Tweet rate is the average number of tweets you publish over a given period, typically per day. It includes original tweets, threads, quote tweets, replies, and sometimes retweets depending on how you define “publishing.”
It matters because:
- Regular posting increases your chance of appearing in follower timelines and search results.
- Consistency helps the algorithm learn what to expect from you and who engages with your content.
- More opportunities to engage mean more signals (likes, replies, retweets) that inform future distribution.
The goal isn’t just more tweets; it’s a sustainable cadence that maximizes reach and engagement without diluting quality.
How X/Twitter’s Algorithm Interprets Posting Frequency
While the platform doesn’t publish a full ranking formula, observable signals suggest:
- Recency: Fresh content tends to be prioritized in timelines.
- Engagement velocity: Tweets that attract quick interactions (likes, replies, retweets) get more distribution.
- Author reputation: Consistency and historical engagement rate contribute to credibility.
- Relevance: Topic and keyword alignment, plus who engages with you, impact which audiences see your tweets.
- Network effects: Interactions with accounts your audience follows can boost visibility.
- Variety and format: Threads, media, and replies may perform differently depending on the audience and context.
How frequency factors in:
- Posting regularly increases the chance that at least one tweet hits engagement velocity during audience peak time.
- Too many low-quality or highly repetitive posts can reduce average engagement per tweet, signaling lower relevance.
- Spacing tweets helps avoid self-competition in the feed and increases per-tweet performance.
High vs. Low Tweet Rate: Which Works Best?
High tweet rate (e.g., 10–20+ tweets/day) can be powerful for real-time news, commentary, and large accounts where audience demand is high. Low to moderate tweet rate (e.g., 3–8 tweets/day) often works better for educational creators, B2B brands, and personal accounts that need time to craft quality content.
Consider account size, niche, and audience expectations:
| Account Size | News/Commentary | Creator/Education | SaaS/Brand | Entertainment/Memes |
|---|---|---|---|---|
| Nano (<5k followers) | 8–12/day (short updates) | 3–6/day (threads 1–2/week) | 3–5/day (mix of value + replies) | 5–10/day (spread out) |
| Mid (5k–100k) | 12–20/day (live commentary) | 5–10/day (threads 2–3/week) | 5–8/day (product + expertise) | 8–15/day (experiment with bursts) |
| Large (>100k) | 20–40/day (team-assisted) | 6–12/day (high-production threads) | 6–10/day (campaign-driven) | 12–25/day (community-led) |
Use these ranges as starting points, then tune for your audience.
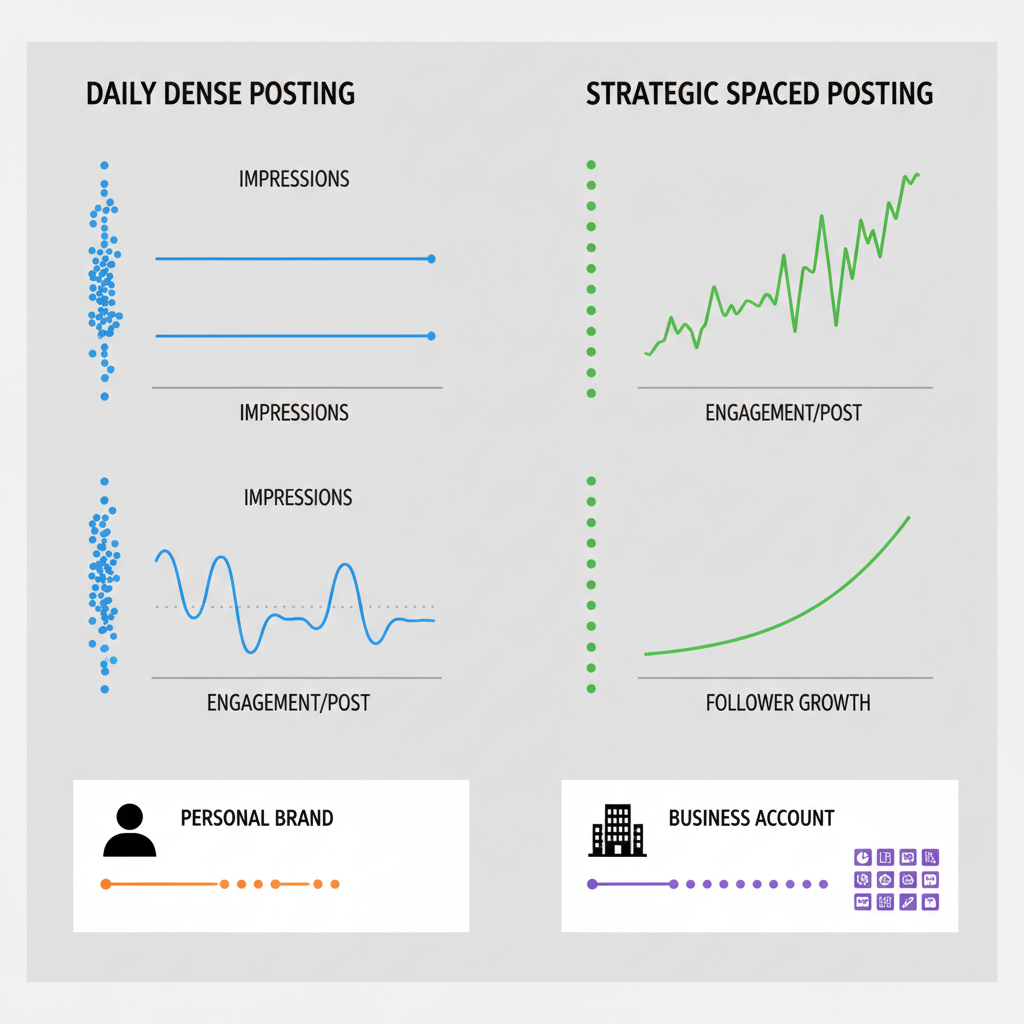
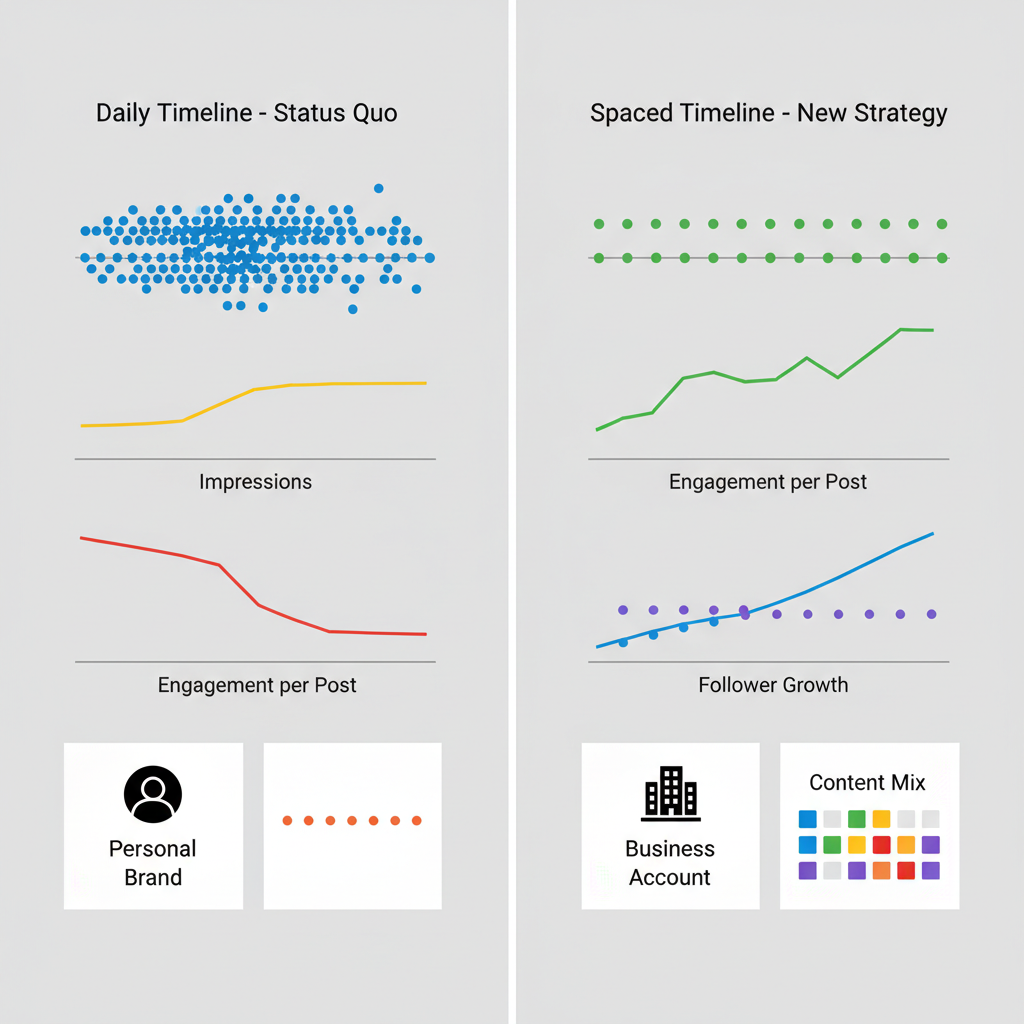
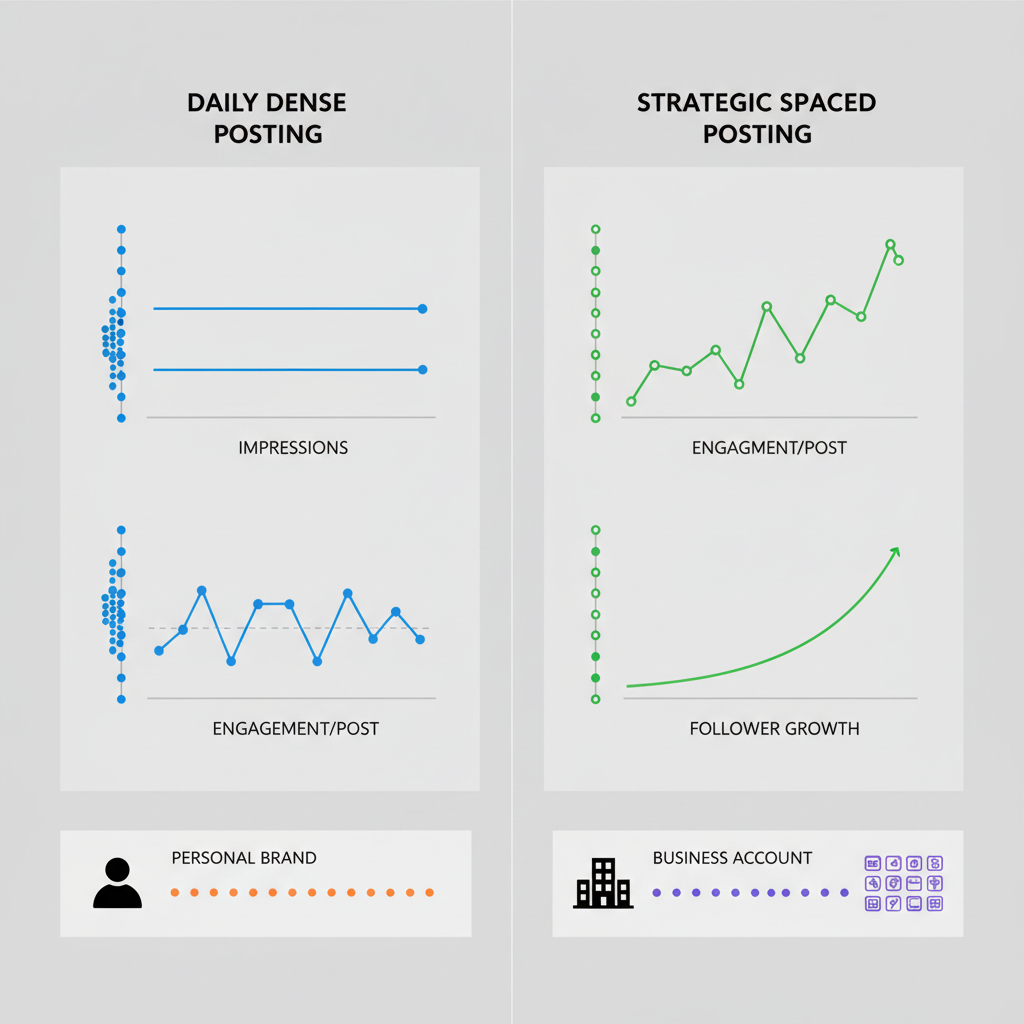
Best Tweet Rates: Personal Brands vs. Business Accounts
Personal brands:
- 4–10 tweets per day is a healthy baseline for most creators.
- Prioritize threads 2–3 times per week; they often drive higher dwell time and follows.
- Mix in replies to peers and quote tweets to enter existing conversations without spamming.
Business accounts:
- 5–8 tweets per day works well for many B2B and SaaS brands.
- Balance product news with expert commentary, customer stories, and community prompts.
- Limit pure promotional posts to 10–20% of total; engagement-first posts keep the algorithm positive on your account.
If your team can support higher volume with consistent quality and audience fit, scale gradually.
Timing and Intervals: How to Experiment
Your audience is unique. The best schedule depends on where your followers are and when they scroll.
Experiment like this:
- Identify 2–3 peak windows based on your analytics (e.g., 8–10 AM, 12–2 PM, 7–9 PM local time).
- Space tweets 30–120 minutes apart during peaks; 2–4 hours during off-peak.
- Avoid posting two high-priority tweets within 15 minutes; they will compete for attention.
- Test a “burst” hour once per week (3–4 tweets within an hour) to see if real-time dialog increases reach.
Interval Examples
- Morning: 8:15, 9:30, 10:45
- Midday: 12:10, 1:20, 2:35
- Evening: 7:05, 8:20, 9:40
If you’re global, rotate peak windows by region or use separate language/community handles.
Use Analytics to Track Impressions, Engagement, and Follower Growth
Metrics that matter:
- Impressions per tweet: Raw visibility; helps identify content types that the algorithm pushes.
- Engagement rate (ER): (Likes + replies + retweets + bookmarks) / impressions. Higher ER suggests strong relevance.
- Profile clicks and follower growth: Signals whether content converts attention into audience.
- Link clicks: Useful for business goals; compare to impressions to avoid vanity metrics.
A simple formula for engagement rate:
def engagement_rate(impressions, likes, replies, retweets, bookmarks=0):
    if impressions <= 0:
        return 0.0
    interactions = likes + replies + retweets + bookmarks
    return round((interactions / impressions) * 100, 2)  # percentage
Track trends over weeks, not days, to avoid reacting to noise. Look for:
- ER stability while increasing tweet rate (positive sign).
- Rising total impressions without falling ER.
- Sustained follower growth during test intervals.
Adjust Tweet Rate by Content Type
Not all tweets should be treated equally. Threads, media posts, polls, and replies each have different consumption patterns.
| Content Type | Recommended Frequency | Suggested Spacing | Notes |
|---|---|---|---|
| Threads (5–12 tweets) | 2–3/week | Avoid other posts ±30–45 min | Pin for 24h; reply to comments to boost |
| Media (images/video) | 1–3/day | 60–120 min apart | Use descriptive text; video tends to drive higher dwell |
| Polls | 1–2/week | 90–180 min buffer | Run during peak windows; ask clear, relevant questions |
| Replies/Quote Tweets | 5–10/day (varies) | Spread across sessions | Engage with peers/customers; adds network signals |
Avoid posting a major thread and a critical announcement in the same hour. Let each piece breathe.
Scheduling Tools to Maintain Consistency
If you’re aiming for a steady tweet rate, scheduling helps you stay consistent while protecting quality.
Tools to consider:
- X’s native scheduling via X Pro (TweetDeck): Good for threads and multi-account management.
- Buffer or Hootsuite: Simple queues, analytics, and team collaboration.
- Sprout Social or Later: Strong reporting and approval workflows.
- Typefully or Hypefury: Creator-focused drafting, thread previews, and inspiration flows.
Example: A Weekly Schedule File (CSV)
You can maintain a simple schedule file and import it to your tool of choice.
datetime,content_type,text,media
2025-10-01 08:15,thread,"5 lessons from building a SaaS...",
2025-10-01 09:30,reply,"@peer Great point—here’s a case study...",
2025-10-01 12:10,media,"Infographic: onboarding funnel benchmarks",onboarding.png
2025-10-01 19:05,poll,"Which topic should I write about next?",
This helps you balance content types and spacing without micromanaging every post in real time.
Pitfalls of Over-Posting and How to Avoid Follower Fatigue
Over-posting is publishing so frequently that average quality drops or your audience feels overwhelmed.
Common pitfalls:
- Content cannibalization: Two high-value tweets within minutes compete for attention.
- Repetition: Reposting similar messages daily leads to mutes, not follows.
- Unbalanced mix: Too many promotional tweets make the account feel like an ad feed.
- Neglecting replies: Broadcasting without dialog reduces network effects and perceived authenticity.
How to avoid:
- Cap bursts to 3–4 tweets/hour and only during key events or live coverage.
- Use a 20–30% buffer for “no post” periods to let top tweets accrue engagement.
- Maintain a content ratio (e.g., 40% educational, 30% engagement prompts, 20% community replies, 10% promo).
- Rotate formats and angles; refresh topics weekly with new data or stories.
Case Studies: How Optimizing Tweet Rate Improves Growth
These composite examples are based on common patterns observed by creators and brands; use them as directional guidance rather than strict rules.
- Creator Educator (25k followers)
- Before: 3–4 tweets/day, no threads, average ER 1.2%, follower growth +100/month.
- Change: Introduced 2 threads/week, increased to 6–8 tweets/day, spaced 60–90 minutes.
- After 8 weeks: ER 1.8%, impressions +65%, follower growth +420/month.
- SaaS Brand (80k followers)
- Before: 8–10 tweets/day, heavy promotional content, ER 0.6%, link clicks flat.
- Change: Shifted to 5–7 tweets/day, 20% promo, added customer stories and polls, peak posting in AM/PM windows.
- After 6 weeks: ER 1.1%, impressions +40%, link clicks +28%.
- News/Commentary Account (350k followers)
- Before: 30+ tweets/day, uneven spacing, frequent self-competition.
- Change: Introduced thread scheduling and spacing rules, limited bursts to event windows.
- After 4 weeks: ER stable at 0.9% with total impressions +35%; follower churn decreased.
Even modest improvements in engagement rate compound over time to more reach and follower growth.
A 4-Week Action Plan to Test and Refine Your Tweet Rate
Week 1: Baseline and Setup
- Audit current tweet rate, content mix, and timing.
- Identify 2–3 peak windows; set a starting cadence (e.g., 6/day for personal, 7/day for business).
- Prepare a 7-day content calendar with a balanced mix:
- 2 threads
- 6–8 media posts
- 2 polls
- Daily replies/quote tweets
- Enable analytics tracking: impressions, engagement rate, follower counts, link clicks.
Week 2: Controlled Experiment
- Increase tweet rate by 20–30%, or reduce it if you’re already high, keeping quality consistent.
- Apply spacing rules (60–120 minutes) and avoid double-posting high-priority tweets within 30 minutes.
- Run one “burst hour” test tied to a live event or conversation.
- Compare ER and impressions to Week 1; note any changes in follower growth.
Week 3: Content-Type Optimization
- Identify top-performing formats and allocate more slots to them.
- If threads outperform, schedule 2–3 this week and pin the best one for 24 hours.
- If media posts drive higher impressions, distribute them across peak windows.
- Adjust tweet rate up or down by 10–20% based on whether ER is stable or falling.
Week 4: Timing Refinement and Scalability
- Shift 20–30% of tweets to alternate peak windows or new time zones if your audience is global.
- Experiment with weekend vs. weekday cadence; many niches see strong weekend performance.
- Introduce a lightweight approval checklist to ensure quality:
- Clear hook
- Unique angle or insight
- Visual or data point
- Call to action (question, link, or prompt)
- Lock in a sustainable tweet rate and create a rolling two-week content pipeline.
Measurement and Decision Rules
At the end of the four weeks:
- If impressions increased and ER stayed stable or improved, you can maintain or slightly increase tweet rate.
- If ER declined while impressions barely moved, reduce tweet rate by 15–25% and focus on higher-quality formats.
- If follower growth improved, identify which content and timing contributed; keep those patterns and trim the rest.
Practical Tips for Sustaining an Optimal Tweet Rate
- Draft in batches: Write 10–20 posts in one session; schedule for the week.
- Use templates: Hooks, data points, story arcs, and CTAs you can remix quickly.
- Monitor in real time: When a tweet starts taking off, avoid posting a conflicting update for 30–60 minutes.
- Repurpose smartly: Turn long-form posts into threads and threads into individual insights spaced over days.
- Protect quality: If you have nothing valuable for a time slot, skip it; an empty gap beats filler.
FAQ: Best Tweet Rate on X/Twitter
- How often should you post on X to grow? For most personal brands, 4–10 tweets per day is a solid starting point; for business accounts, 5–8 per day with a balanced mix works well.
- Do replies count toward tweet rate? Yes. Replies and quote tweets contribute to activity and network effects, but avoid flooding with low-value replies.
- Is it better to post threads or single tweets? Threads often drive follows and dwell time; use 2–3 per week alongside daily singles, media, and replies.
- What if engagement drops after increasing frequency? Scale back by 15–25% and refocus on your highest-performing formats and time windows.
Conclusion
Your ideal tweet rate depends on your audience, niche, and capacity to publish consistently high-quality content. Start with a reasonable baseline, experiment with spacing and timing, and use analytics to guide adjustments. For most personal brands, 4–10 tweets per day strikes a good balance. For business accounts, 5–8 posts daily with a strong mix of educational and community content works well. Optimize with threads, media, and replies, and avoid cannibalizing your best work by posting too tightly.
Summary and next steps:
- Set a baseline tweet rate (personal: 4–10/day; business: 5–8/day).
- Choose 2–3 peak windows and apply 60–120 minute spacing.
- Track ER, impressions, and follower growth weekly.
- Adjust cadence by 10–20% based on results.
Call to action: Start your 4-week test today—block 30 minutes to draft your next 10 posts, schedule the first three, and review analytics at the end of the week to fine-tune your best tweet rate.