Instagram Ads Cost in 2025: Pricing, Benchmarks, and How to Lower Your CPA
See 2025 Instagram ads cost benchmarks by objective and placement, how Meta’s auction sets CPM/CPC, and tactics to lower CPA with smarter bidding and creative.
Planning Instagram ad spend in 2025 means balancing reach with efficiency while keeping an eye on auction dynamics. This formatting-optimized guide outlines how pricing works, what current benchmarks look like by objective and placement, and the mechanics of bidding, forecasting, creative, and audiences that influence CPC and CPA. Use it to structure tests, estimate costs, and scale with control.
Instagram Ads Cost in 2025: Pricing, Benchmarks, and How to Lower Your CPA
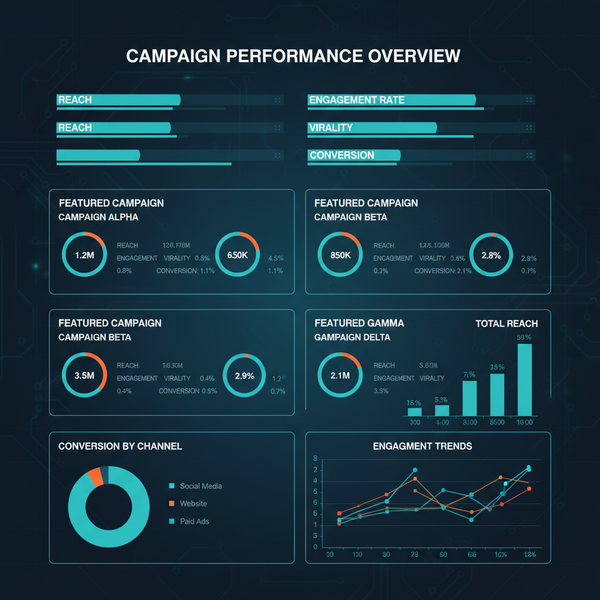
![hero]()
If you’re planning paid social this year, understanding Instagram ads cost is essential for hitting your growth goals without overspending. This guide explains how pricing works, what to expect in 2025 by objective and placement, and how to lower your CPC and CPA with smarter bidding, creative, and audience strategy. If you’re evaluating instagram.ads cost specifically for a new market or product, you’ll also find formulas and a worked forecast to de-risk your first test.
How Instagram ads pricing works
Instagram ads run inside Meta’s unified auction. The auction doesn’t simply award the highest monetary bid; it picks the ad with the highest Total Value to the user and the platform.
- Auction mechanics:
- Total Value = Bid x Estimated Action Rate (EAR) + Ad Quality + User Value adjustments
- You compete against other advertisers for the same impression at that moment
- You typically pay the minimum amount required to win (a variant of second‑price dynamics)
- Key levers that affect CPC, CPM, and ultimately CPA:
- Expected Action Rate (EAR): How likely your target user is to click, view, or convert, predicted from historical performance and user signals.
- Quality Ranking: Meta’s diagnostics (Quality, Engagement Rate, Conversion Rate rankings vs peers). Low rankings raise your costs.
- Competition: More bidders for the same audience/timeframe drive CPM up, especially during retail peaks.
- Relevance and Fit: Creative that matches placement and intent improves EAR, lowering CPC and CPM.
- Costs cascade:
- Higher CPM comes from tight supply or hot competition
- CPC = CPM / (1000 x CTR). Improve CTR to reduce CPC even at the same CPM.
- CPA = CPC / CVR. Improve landing page and checkout conversion rates to reduce CPA even at the same CPC.
![diagram]()
2025 benchmark ranges
Benchmarks vary by country, vertical, and funnel stage. Use these 2025 ranges as directional anchors for planning; your actuals may differ.
Typical ranges by objective and placement (US, mixed verticals)
| Objective | Placement | CPM (USD) | CPC (USD) | CTR | CPA/CPI (USD) |
|---|---|---|---|---|---|
| Traffic | Feed | $7–$18 | $0.80–$2.50 | 0.6%–1.6% | $2–$8 per LP view |
| Traffic | Stories | $6–$16 | $0.60–$2.00 | 0.7%–1.8% | $2–$7 per LP view |
| Traffic | Reels | $5–$14 | $0.50–$1.80 | 0.8%–2.2% | $2–$6 per LP view |
| Conversions (Purchase) | Feed | $8–$22 | $1.00–$3.00 | 0.5%–1.3% | $15–$80+ |
| Conversions (Purchase) | Stories | $7–$20 | $0.80–$2.50 | 0.6%–1.5% | $12–$70+ |
| Conversions (Purchase) | Reels | $6–$18 | $0.70–$2.00 | 0.7%–1.8% | $10–$65+ |
| App Installs | All IG placements | $5–$16 | $0.50–$1.80 | 0.9%–2.5% | $2–$8 CPI (B2C) / $6–$20 CPI (B2B) |
| Lead Gen | All IG placements | $7–$18 | $0.80–$2.50 | 0.6%–1.6% | $8–$45 per lead (B2C) / $25–$150 (B2B) |
Notes:
- B2B tends to see higher CPC and CPA but better downstream LTV. Expect lower CTR (more consideration) and longer sales cycles.
- Emerging markets usually show lower CPMs; Tier 1 geos (US, CA, UK, AU, DE) trend higher.
Bid strategies explained
Meta offers three core bid strategies that meaningfully shape your spend stability and efficiency.
| Strategy | What it does | When to use | Trade-offs |
|---|---|---|---|
| Lowest Cost (no cap) | Maximizes volume at the cheapest available cost in the auction | Exploration, broad prospecting, learning phase acceleration | CPA can fluctuate; may overshoot your target in high-competition periods |
| Cost Cap | Optimizes to stay around a target CPA/CPI while seeking scale | When you know your break-even CPA and want controlled efficiency | Too tight a cap reduces delivery; set slightly above true target to avoid throttling |
| Bid Cap | Sets a hard ceiling on bids in the auction | Advanced accounts with volatile auctions or strict unit economics | High risk of under-delivery; requires frequent tuning and robust data |
Guidance:
- Start with Lowest Cost to gather data, then migrate mature ad sets to Cost Cap pegged ~10–20% above your target CPA.
- Use Bid Cap sparingly for retargeting or where you know your clearing prices; monitor delivery and overlap closely.
Budgeting and forecasting
Use simple math to turn CPM/CTR/CVR assumptions into a plan. Keep your assumptions conservative and validate with a small test.
Formulas:
Impressions = (Spend / CPM) * 1000
Clicks = Impressions * CTR
Landing Page Views (LPV) ≈ Clicks * 0.85 to 0.95 (depends on page load)
Purchases = Clicks * CVR  OR  LPV * On-site CVR
CPC = Spend / Clicks
CPA = Spend / Purchases
ROAS = Revenue / Spend
Worked example (prospecting, US ecom):
Assumptions:
- Test Budget: $2,000
- CPM: $14
- CTR: 1.0%
- On-site CVR from click: 2.0%
- AOV: $70

Calculations:
Impressions = (2000 / 14) * 1000 ≈ 142,857
Clicks = 142,857 * 0.010 = 1,429
Purchases = 1,429 * 0.02 ≈ 28.6 ≈ 29
CPC = 2000 / 1429 ≈ $1.40
CPA = 2000 / 29 ≈ $69
Revenue ≈ 29 * $70 = $2,030
ROAS ≈ 1.02
Interpretation: You’re near breakeven on prospecting. Improve CTR and CVR, and layer in retargeting to lift blended ROAS.
Audience strategy impact on costs
- Broad vs detailed targeting:
- Broad (Advantage+ audience): Leverages platform signals to find converters; usually lower CPM and stable scaling.
- Detailed interests: Useful for creative angle testing and early signal shaping; can increase CPM if too narrow.
- Lookalikes:
- High-quality seeds (recent purchasers, high LTV) outperform generic seeds. Test 1%, 2–5%, and value-based lookalikes.
- Retargeting:
- Best CPAs but limited scale. Focus on recent site visitors, cart abandoners, and high-intent engagers.
- Exclusions:
- Exclude recent purchasers and overlapping ad sets to prevent cannibalization and inflated frequency.
- Frequency control:
- Watch frequency > 2.5/week on prospecting as a fatigue warning. Rotate creative and widen audience or placements.
- Overlap management:
- Use Meta’s Audience Overlap tool. If >30–40% overlap between active ad sets, consolidate or separate by intent or geo.
Creative and placement optimization to cut costs
Creative is the fastest lever to improve EAR and drop CPC/CPA.
- Format choices:
- Reels and Stories often deliver lower CPM and higher thumbstop rates. Feed is strong for consideration and longer captions.
- Use square (1:1) and vertical (9:16) variants; avoid auto-cropping important visuals.
- Thumbstop tactics:
- Front-load motion in the first 1–2 seconds, add bold captions, and show product-in-use immediately.
- Video length:
- 6–15 seconds for prospecting; 15–30 seconds when explaining complex value props.
- UGC-style creatives:
- Native, lo-fi content with on-screen text and voiceover often outperforms studio assets on Instagram.
- Best practices by placement:
- Feed: Clear hooks, strong CTAs; longer copy ok. Use carousels for feature/benefit sequencing.
- Stories: Full-screen vertical; add native elements (stickers, countdowns). Keep pacing quick with scene cuts.
- Reels: Entertain first, sell second. Use trending audio styles (copyright-safe) and punchy captions.
- Fighting ad fatigue:
- Introduce 2–3 new creatives per ad set every 10–14 days at scale.
- Use creative clusters by angle (price/value, social proof, problem/solution) and rotate systematically.
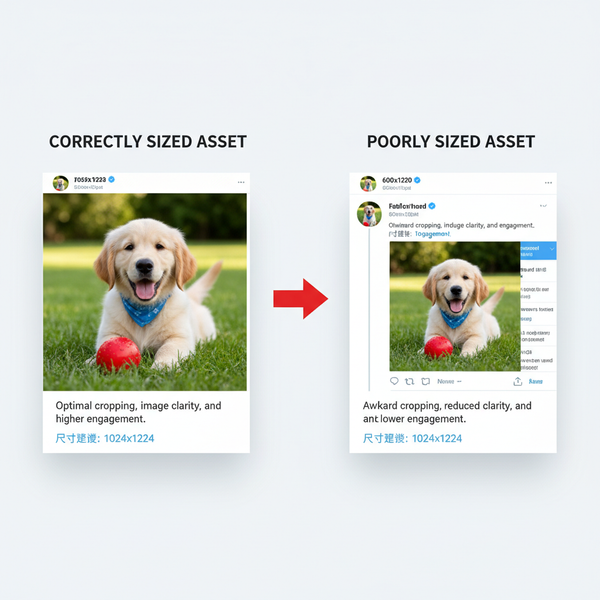
![creative-examples]()
Measurement and attribution
Accurate tracking is critical to understand true instagram.ads cost and reported CPA.
- Pixel and CAPI:
- Implement both Meta Pixel and Conversions API to mitigate signal loss (server-side + browser events).
- Deduplicate events using event IDs.
- Conversion windows:
- Default 7-day click, 1-day view works for most ecom. For high consideration, test 7dC/0dV; for apps, 1dC/0dV if needed.
- Learning phase:
- Aim for ~50 optimization events per ad set per week. Consolidate budgets to exit learning faster and stabilize costs.
- Aggregated Event Measurement (AEM):
- Prioritize events (Purchase, Add to Cart, View Content, etc.). Ensure your optimization event is within the top prioritized slots.
- Impact on reported CPA:
- Shorter windows reduce attributed conversions (CPA looks worse but is closer to last-click reality).
- CAPI improves match rates, usually lowering reported CPA by recovering otherwise-missed conversions.
- Offline and MMM:
- If significant offline conversions occur, sync Offline Conversions. For mature spenders, run lightweight MMM to triangulate true incrementality.
Seasonality and market dynamics
- Q4 spikes:
- Expect CPM to rise 20–100% during peak retail weeks (Singles’ Day, Black Friday/Cyber Monday, Christmas). Lock creative and budgets early.
- Vertical differences:
- Beauty, fashion, and CPG often get cheaper CPCs but need strong AOV/upsells to sustain ROAS. SaaS/B2B pays more per lead but wins on LTV.
- Geo effects:
- Tier 1 markets are pricier but often convert better. Localize creative and pricing to maintain CVR in new geos.
- Privacy changes:
- Continued platform privacy updates may reduce retargeting pool sizes and signal granularity. CAPI and broad targeting offset some impact.
- Always-on testing cadence:
- Weekly: creative refreshes and angle testing.
- Biweekly: audience and placement tests.
- Monthly: bid strategy and budget reallocation based on MER/ROAS.
Common pitfalls and a cost-reduction checklist
Avoid these issues that inflate Instagram ads cost:
- Weak or unclear offer (no urgency, no differentiation)
- Limited budgets across too many ad sets (stuck in learning)
- Cramped audiences with high overlap and frequency
- Underpowered bids (overly tight Cost/Bid Caps causing under-delivery)
- Slow, non-mobile-optimized landing pages
- Poor attribution setup (no CAPI, wrong conversion window)
- Creative fatigue and mismatched formats by placement
- Ignoring post-click CVR levers (shipping, trust badges, checkout friction)
Cost-reduction checklist:
- Offer and pricing
- Craft a compelling hook (discount, bundle, free shipping) and test urgency variants.
- Measurement
- Verify Pixel + CAPI, event priority, and deduplication. Confirm 7dC/1dV vs 7dC/0dV fit.
- Bidding
- Start Lowest Cost; migrate winners to Cost Cap ~10–20% above target CPA.
- Budgets
- Consolidate to hit 50+ events/week per ad set. Scale winners 10–20% every few days.
- Audiences
- Run broad + LAL + retargeting with clean exclusions; monitor overlap monthly.
- Creative
- Produce 3–5 new UGC-style assets biweekly; tailor to Feed, Stories, and Reels. Test hooks and CTAs.
- Landing page
- Sub-2s mobile load, social proof, clear value props, simplified checkout. Track CVR and bounce.
- Placements
- Use Advantage+ placements to start; pin placements only if data supports it.
- Seasonality
- Front-load tests pre-Q4; maintain backup budgets for volatile weeks.
Final thoughts
Instagram remains a high-intent, visual channel with scalable reach. Costs in 2025 are manageable if you respect the auction’s incentives: deliver quality, relevant experiences and strong post-click performance. Start broad, measure cleanly, iterate creative relentlessly, and align bids and budgets to your unit economics. That’s how you bring CPC down, stabilize CPM, and push CPA below your target—without shrinking your growth.
Summary
This guide outlines how Meta’s auction, creative relevance, audience strategy, and bidding shape Instagram ad costs in 2025, with directional benchmarks by objective and placement. Use the included formulas and worked example to forecast spend-to-outcome, then reduce CPA by improving CTR and on-site CVR, deploying Cost Caps carefully, and maintaining clean tracking via Pixel + CAPI. Keep testing cadence steady, watch seasonality pressures, and refresh creatives frequently to sustain efficiency at scale.