How Much Does It Cost to Advertise on Instagram in 2025? Pricing Benchmarks, Budgeting, and Cost-Lowering Tactics
See 2025 Instagram ad costs with CPM, CPC, CPA, CPL benchmarks. Learn how Meta’s auction works and get budgeting, bidding, placements, creative tips to cut CPA.
Planning Instagram ad spend in 2025 requires clear benchmarks and a working knowledge of how Meta’s auction influences what you pay. This guide compiles up‑to‑date CPM, CPC, CPA, and CPL ranges, then connects those numbers to the levers you control—objectives, bidding, placements, and creative. Use it to budget, forecast, and test methodically while keeping acquisition costs in check.
How Much Does It Cost to Advertise on Instagram in 2025? Pricing Benchmarks, Budgeting, and Cost-Lowering Tactics
![hero]()
If you’re planning your 2025 media mix, you’re probably asking: what’s the cost to advertise on Instagram right now, and how can I control it? Below you’ll find current pricing benchmarks (CPM, CPC, CPA, CPL), how Meta’s auction sets your price, and concrete tactics to lower costs without starving performance.
The quick answer: 2025 Instagram ad cost ranges
Costs vary by country, audience, vertical, and competition. Across commonly targeted Tier‑1 markets (US, CA, UK, AU), recent 2024–2025 ranges marketers report look like this:
| Metric | Typical 2025 Range (Tier‑1) | Global/Wider Markets | Notes |
|---|---|---|---|
| CPM (Cost per 1,000 impressions) | $7–$18 | $2–$10 | Peaks during Q4, big retail moments; lower for broad audiences. |
| CPC (Cost per click) | $0.70–$2.50 | $0.20–$1.20 | Varies with CTR and creative; Reels often cheaper CPC via higher CTR. |
| CPA (Purchase/Install) | $12–$80+ | $4–$40+ | Wide by vertical; subscription & B2B lead-to-revenue CPAs trend higher. |
| CPL (Qualified lead) | $6–$30 | $2–$15 | On‑platform Instant Forms often reduce CPL vs. website forms. |
Why the variance
- Geo: Tier‑1 markets face higher competition and stronger purchasing power.
- Objective and optimization: Optimizing for purchases raises CPM but can lower CPA.
- Placement and format: Reels and Stories often deliver lower CPM, Feed may produce higher purchase intent.
- Seasonality: Expect higher CPM in Q4 and around Prime Day‑style events.
- Ad quality and relevance: Strong creative increases predicted action rates, improving auction outcomes.
How Instagram’s auction sets your price
Instagram (via Meta Ads) runs a second‑price–style auction. You don’t “pay more” just because you set a high bid. Instead, the system calculates total value for each impression:
Total value = your bid strategy + estimated action rates + ad quality
- Bid strategy: Lowest cost, cost cap, or bid cap.
- Estimated action rates: How likely your audience is to take the desired action (click, view, purchase).
- Ad quality: Feedback, relevance, historical performance, and compliance.
![diagram]()
The ad with the highest total value wins, and you pay just enough to beat the next best ad given their total value.
The learning phase and volatility
New ad sets enter the learning phase as the delivery system gathers enough conversion signals (typically ~50 optimization events within 7 days). During learning:
- Performance volatility is normal.
- CPMs may be inefficient while the system explores pockets of your audience.
- Avoid major edits; they reset learning. Bundle edits, and let tests run 3–7 days unless performance is clearly off‑track.
Key cost drivers you can control
- Audience size and intent
- Broader audiences (1M+) often yield lower CPM but mixed intent.
- High‑intent audiences (retargeting, cart abandoners) typically cost more per impression but deliver better CPA.
- Geo and industry
- Tier‑1 CPMs are higher; niche B2B segments might see low CTRs and higher CPC.
- Placements (Feed, Stories, Reels)
- Reels/Stories can reduce CPM; Feed may convert better for higher‑consideration products.
- Optimization event
- Optimize to the deepest event you can sustain signal for (Purchase if you can hit ~50/wk; otherwise Add‑to‑Cart, View Content, or Leads).
- Attribution window
- Shorter windows (1‑day click) can stabilize CAC for fast‑purchase DTC; 7‑day click captures more value for longer sales cycles but can mask creative issues.
- Seasonality and promotions
- Expect 20–60% CPM lifts during peak weeks (e.g., BFCM). Pre‑build creative and budget buffers.
Ad formats and placements that affect cost
Different placements have different supply, user behavior, and norms. The interplay of CPM, CTR, and downstream conversion drives your final CPA/ROAS.
| Placement/Format | Relative CPM | Typical CTR | Notes on Performance |
|---|---|---|---|
| Reels (Video) | Low–Medium | Medium–High | Great reach, thumb‑stop potential; best with native, fast cuts, captions. |
| Stories (Image/Video) | Low–Medium | Medium | Full‑screen, direct CTAs; strong for promos and time‑sensitive offers. |
| Feed (Image/Carousel/Video) | Medium–High | Low–Medium | Higher intent; carousels for product depth; UGC reduces ad “polish.” |
| Explore | Low | Low–Medium | Cheap awareness; test for prospecting with click‑optimized objectives. |
| Shop/Shopping | Medium | Medium | Catalog ads excel for dynamic retargeting and cross‑sell. |
Tips
- Use Advantage+ placements to let delivery find the cheapest impressions that still convert.
- Keep aspect ratios native (9:16 for Reels/Stories); add burned‑in captions for sound‑off.
- Test short (6–15s) vs. medium (20–35s) cuts; winners differ by vertical.
Objectives and bidding strategies
Choose the objective that matches your funnel stage and signal strength.
- Awareness/Reach: Cheapest CPM; use for launches and top‑funnel scale.
- Traffic: Optimize for landing page views if you need website traffic data.
- Engagement: Useful for social proof before scaling conversion campaigns.
- Leads: On‑platform Instant Forms can lower CPL and increase volume.
- Sales (Purchases): Best for eCommerce with sufficient conversions.
- App promotion: Use app install + in‑app event optimization once you have volume.
Bidding strategies
- Lowest cost: Max volume; CAC fluctuates with competition. Good for learning and smaller budgets.
- Cost cap: Targets an average CPA/ROAS; steadier costs but may limit scale if too strict.
- Bid cap: Hard ceiling per event; strong control, but can throttle delivery and raise CPM if set unrealistically.
Rule of thumb
- Start with lowest cost to find a baseline CPA/ROAS.
- Move to cost cap once you have stable conversion rates.
- Use bid cap for tight CAC control in retargeting or niche segments.
Budget planning and forecasting
Daily vs. lifetime budgets
- Daily budgets: Simpler pacing; good for always‑on campaigns. Limited ad scheduling controls.
- Lifetime budgets: Allows dayparting by hours/day; helpful when your audience converts at specific times.
Sample monthly budgets and expected outcomes (assumptions noted)
Assumptions
- CPM: $10 (Tier‑1 blended)
- CTR: 1.2%
- Landing‑page CVR (click to purchase): 2.5%
- Add 20% variance for seasonality/creative swings
| Scenario | Monthly Spend | Impressions | Clicks | Purchases | Blended CPA |
|---|---|---|---|---|---|
| SMB starter (Prospecting+Retargeting 70/30) | $3,000 | 300,000 | 3,600 | 90 | $33 |
| DTC growth (ASC + Retargeting) | $15,000 | 1,500,000 | 18,000 | 450 | $33 |
| App UA (Install + Purchase event) | $20,000 | 2,000,000 | 24,000 | 480 (post‑install purchase) | $41.67 |
Formulas you can reuse
- Impressions = Spend / (CPM / 1000)
- Clicks = Impressions × CTR
- Purchases = Clicks × CVR
- CPA = Spend / Purchases
Break‑even and ROAS targets
- Break‑even CAC (eCommerce) = LTV × gross margin% × contribution to acquisition
- If using order‑level targets: Target ROAS ≈ 1 / gross margin. Example: 60% margin → 1.67x ROAS to break even on ad spend.
Quick calculator:
## Inputs

aov = 80.0              # average order value
gross_margin = 0.6      # 60%
repeat_orders = 1.5     # within attribution horizon
ltv = aov * repeat_orders * gross_margin
target_contribution = 1.0  # acquire at break-even gross profit

break_even_cac = ltv * target_contribution
target_roas = 1 / (gross_margin)  # order-level ROAS

print("Break-even CAC:", round(break_even_cac, 2))
print("Target ROAS:", round(target_roas, 2))
Benchmarks by funnel stage and scenario
| Funnel/Use Case | CPM | CTR | CVR | Typical CPA/CPI | Notes |
|---|---|---|---|---|---|
| Prospecting (DTC eCommerce) | $8–$16 | 0.8%–1.5% | 1.0%–3.0% | $25–$80 | Lower CAC with bundles, promos, and strong UGC. |
| Retargeting (View→Cart→Purchase) | $10–$20 | 1.5%–3.0% | 3%–10% | $8–$35 | Cap frequency; rotate creatives to avoid fatigue. |
| Mobile App UA (Install) | $5–$12 | 0.7%–1.5% | Install rate depends on store; post‑install CVR drives true CPI/CPE. | $1.50–$6.00 CPI | Shift to event‑optimized (purchase/sub) as volume allows. |
| Local Services (Lead gen) | $6–$14 | 0.8%–2.0% | Lead form submit rate varies widely | $8–$40 CPL | Use Instant Forms with qualification questions. |
Realistic goals
- Prospecting CPA at 1.2–1.8x retargeting CPA is common.
- For subscription DTC, measure CAC vs. 60–90 day LTV; shorter windows understate value.
Proven ways to lower Instagram ad costs
Creative iteration frameworks
- Use a 3×3 grid: 3 hooks × 3 visual treatments per angle (product, problem, proof).
- Test UGC vs. founder vs. motion graphics; swap first 2–3 seconds to boost hook rate.
- Add social proof overlays (stars, reviews, press blips) and clear pricing.
- Localize text overlays and CTAs for top geos.
Audience strategy
- Exclusions: Suppress purchasers and recent site visitors to avoid paying for existing demand.
- Lookalikes: Build 1%–3% value‑based lookalikes from high‑LTV purchasers or top cohorts.
- Combine broad (+Advantage+ audience) with retargeting and LALs; let the system find pockets.
Campaign structure
- Advantage+ Shopping Campaigns (ASC): Strong baseline for DTC; feed both new and existing customer segments, set a new customer budget cap when needed.
- Consolidate ad sets to avoid signal dilution; aim for ≥50 conversions per week per optimization event.
- Use Advantage+ placements and creative enhancements (music, image expansion) for cheaper reach.
Frequency management
- Prospecting: Try to keep weekly frequency ~1.5–2.5. If it rises with flat CTR, rotate new creatives.
- Retargeting: Short windows (3–7 days) with higher frequency caps; keep messaging product‑ and offer‑led.
Dayparting and pacing
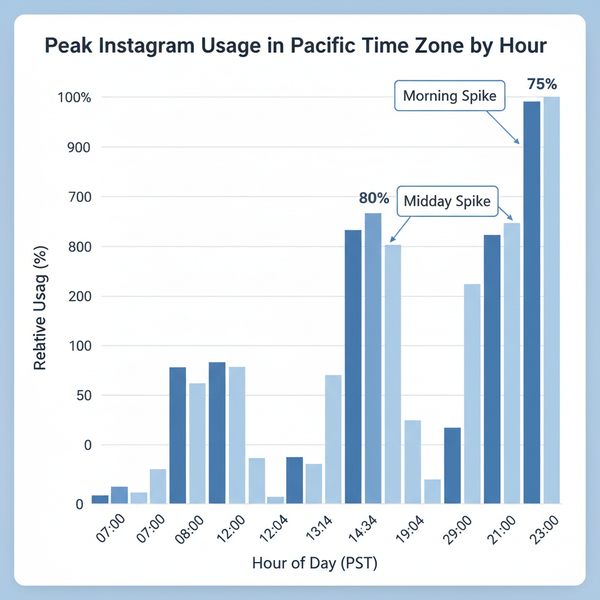
- If your analytics show clear hourly conversion patterns, use lifetime budgets with ad scheduling.
- Avoid sharp daily budget swings; step up spend by 10–20% increments to maintain stability.
Testing cadence
- Run 1–2 meaningful tests per week (hook, angle, offer, format).
- Let tests exit learning; evaluate on cost per result and holdout ROAS, not just CTR.
- Kill underperformers quickly; scale winners across placements and audience segments.
Offer and landing experience
- Tighten offer with time‑bound incentives and bundles to lift CVR.
- Reduce friction: faster load speed, fewer form fields, native lead forms when appropriate.
- Post‑click: Use deep links to product detail pages; sync catalog for dynamic ads.
Hidden costs and measurement
Creative production
- Budget time and cost for ongoing creative: scriptwriting, UGC sourcing, editing, and localization.
- Build templates to quickly swap hooks, overlays, and CTAs.
Tracking stack (Meta Pixel + Conversions API)
- Install Meta Pixel site‑wide; fire standard events (ViewContent, AddToCart, InitiateCheckout, Purchase).
- Implement Conversions API (CAPI) with event deduplication (event_id) to improve signal reliability post‑privacy changes.
- Use a consent management platform and respect user choices; configure Aggregated Event Measurement.
Attribution constraints
- iOS ATT and browser restrictions reduce observable conversions.
- Compare 1‑day click vs. 7‑day click attribution to understand sensitivity.
- Use blended MER (sales/ad spend) alongside platform ROAS for a reality check.
Measuring incremental lift
- Run geo‑split tests or Meta Conversion Lift studies to quantify incremental lift over organic and other channels.
- Use MMM (marketing mix modeling) for long‑horizon budget decisions; validate with periodic holdouts.
Quick pipeline from event setup to reporting
## Pseudocode outline

1) Client (browser) -> Pixel: sends event with event_id, user_data (hashed), event_time
2) Server (backend) -> CAPI: sends same event_id, matching user_data, event_time
3) Meta deduplicates if both arrive
4) Verify in Events Manager: diagnostics, match rate, event priority
5) Align attribution window to buying cycle; monitor Ads Manager vs. backend orders
Putting it together: A simple forecasting workflow
1) Establish your current baseline
- Measure CPM, CTR, CPC, CVR, and CPA by placement and audience segment for two recent weeks outside special promos.
2) Set targets
- Define break‑even CAC and target ROAS based on margin and LTV.
- Choose objective and bidding strategy that aligns with signal volume.
3) Structure campaigns
- Start with ASC for DTC or Advantage+ App Campaigns for UA, plus a retargeting ad set.
- Use Advantage+ placements; limit ad sets to preserve signal.
4) Plan budget and testing
- Allocate 70–80% to proven structures; 20–30% to tests (hooks, offers, formats).
- Ramp budgets gradually; protect winning creatives from test turbulence.
5) Iterate weekly
- Refresh top creatives every 1–2 weeks at prospecting; rotate offers for seasonality.
- Review frequency, creative fatigue indicators (rising CPM, falling CTR), and LTV by cohort.
FAQ: Quick answers to common “cost to advertise on Instagram” questions
- Is Instagram more expensive than Facebook? Often slightly higher CPM in Tier‑1 markets, but creative fit and audience intent can make Instagram more efficient on a CPA/ROAS basis.
- Do Reels always lower costs? Not always, but they often deliver cheaper CPM and higher CTR. Validate with purchase‑optimized tests.
- What’s a good CPA? It’s “good” if it’s below your break‑even CAC and supports your payback period. For many DTC brands, $20–$60 CPA is workable; B2B and high‑ticket will be higher.
- How much should I start with? Many SMBs start at $50–$150/day to establish baselines, then scale once you hit stable CAC.
![funnel]()
Bottom line: The cost to advertise on Instagram in 2025 is manageable if you align objective and bidding with your signal volume, structure campaigns to feed the auction strong predicted action rates, and run a disciplined creative and testing program. Keep one eye on CAC/ROAS and the other on incremental lift, and you’ll scale with confidence.
Summary
Instagram ad costs in 2025 cluster within predictable CPM, CPC, and CPA bands, but your actual price is set by Meta’s auction—specifically your bid strategy, predicted action rates, and ad quality. Control what you pay by matching objectives to signal, using Advantage+ where it helps, and iterating creative and offers on a steady cadence. With clear benchmarks, conservative scaling, and robust measurement, you can maintain efficiency while growing spend.


