Instagram Average Engagement Rate 2025 Trends and Benchmarks
Explore 2025 Instagram engagement rate trends, benchmarks by follower size, content type, and industry, plus strategies to boost authentic interaction.
Understanding Instagram Engagement Rate in 2025
Instagram has evolved dramatically over the past few years, and the Instagram average engagement rate 2025 statistics clearly reveal shifting dynamics in how audiences consume and interact with content. For brands, influencers, and marketers, engagement rate is a crucial metric—it shows how effectively posts resonate and create meaningful interactions. In 2025, as Instagram continues to prioritize authentic engagement over vanity metrics, knowing how to measure, benchmark, and optimize your engagement rate is vital for sustained growth.

---
What Is Engagement Rate on Instagram?
Engagement rate measures how actively your audience interacts with your content relative to your total follower count. It accounts for likes, comments, shares, saves, and other meaningful actions.
Formula for Engagement Rate:
Engagement Rate (%) = (Total Interactions / Total Followers) × 100Total Interactions may include:
- Likes
- Comments
- Shares
- Saves
- Story replies
- Reel interactions (including replays and sticker taps)
---
Global Average Instagram Engagement Rates in 2025
Recent industry reports provide a snapshot of average engagement rates worldwide in 2025:
| Account Size | Average Engagement Rate (%) |
|---|---|
| 1K–10K Followers | 4.85% |
| 10K–50K Followers | 3.67% |
| 50K–100K Followers | 2.91% |
| 100K–500K Followers | 2.25% |
| 500K–1M Followers | 1.89% |
| 1M+ Followers | 1.52% |
Insight: Micro-influencers and smaller accounts maintain higher engagement due to community intimacy and personal interaction.
---
Content-Type Comparison in 2025
Different content formats on Instagram yield varying engagement levels.
| Content Type | Average Engagement Rate (%) | Notes |
|---|---|---|
| Reels | 6.1% | High reach and shareability; boosted by algorithmic favor |
| Carousel Posts | 4.3% | Effective for storytelling across multiple visuals |
| Stories | 3.2% | Ephemeral but valuable for loyal audience retention |
| Live Videos | 5.0% | Interactive Q&A drives real-time engagement |
---
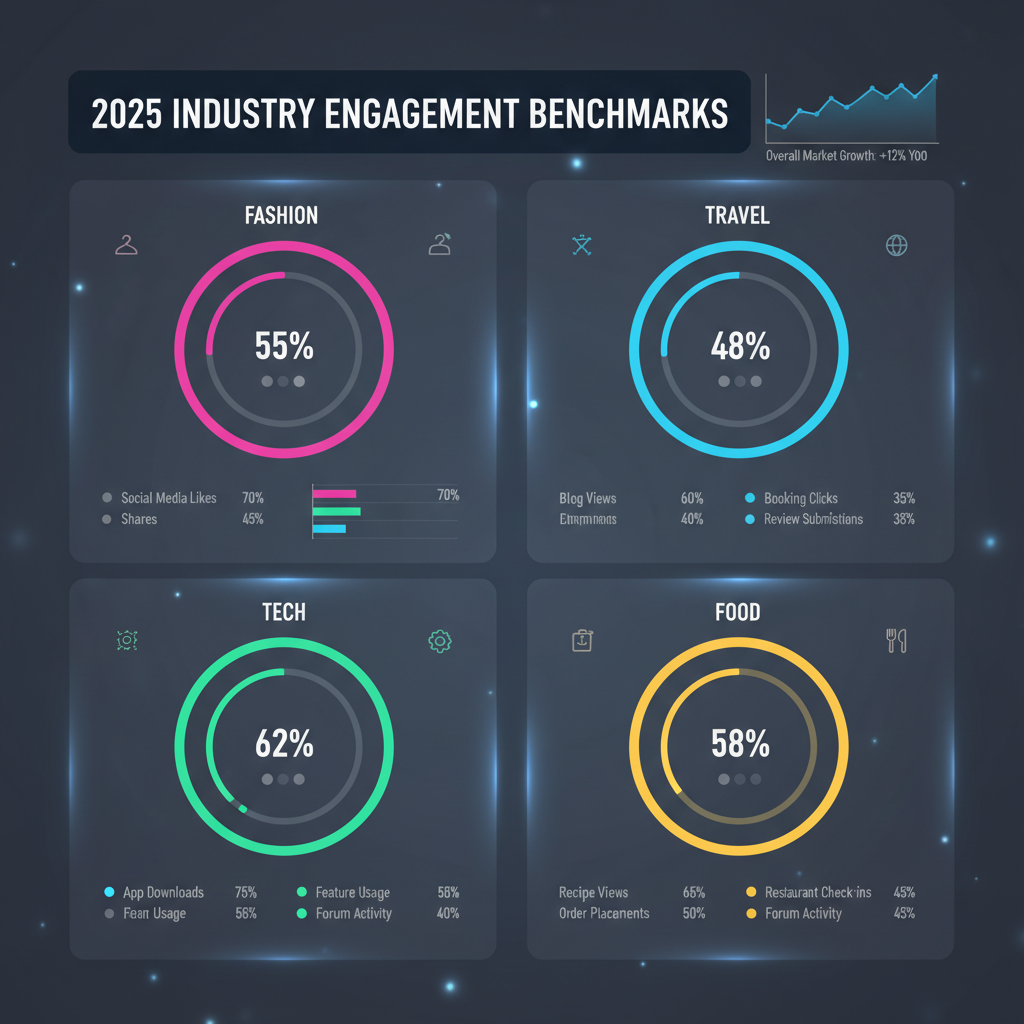
Industry Benchmarks for Engagement in 2025
Engagement rates differ across industries based on audience focus and content style.
| Industry | Average Engagement Rate (%) |
|---|---|
| Fashion | 4.6% |
| Travel | 5.3% |
| Beauty | 4.8% |
| Fitness | 5.0% |
| Tech | 3.5% |
---
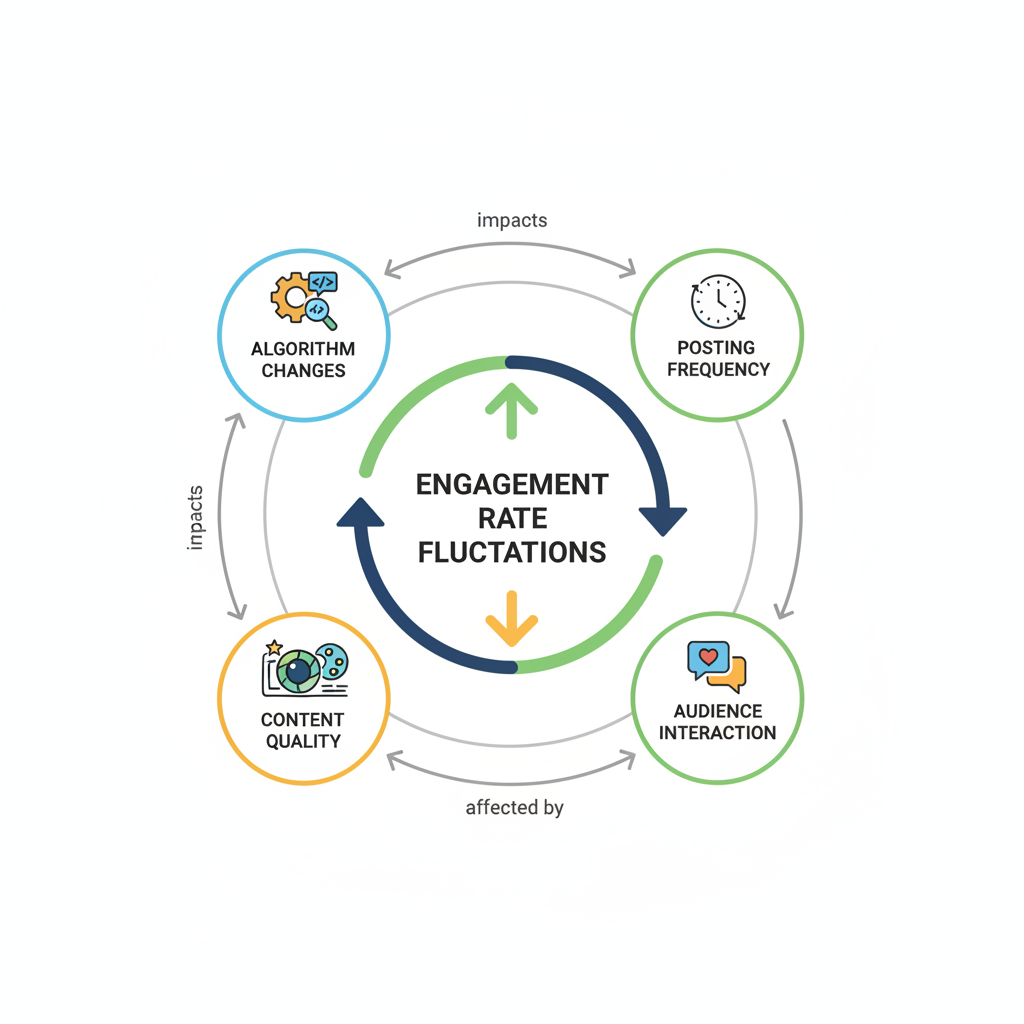
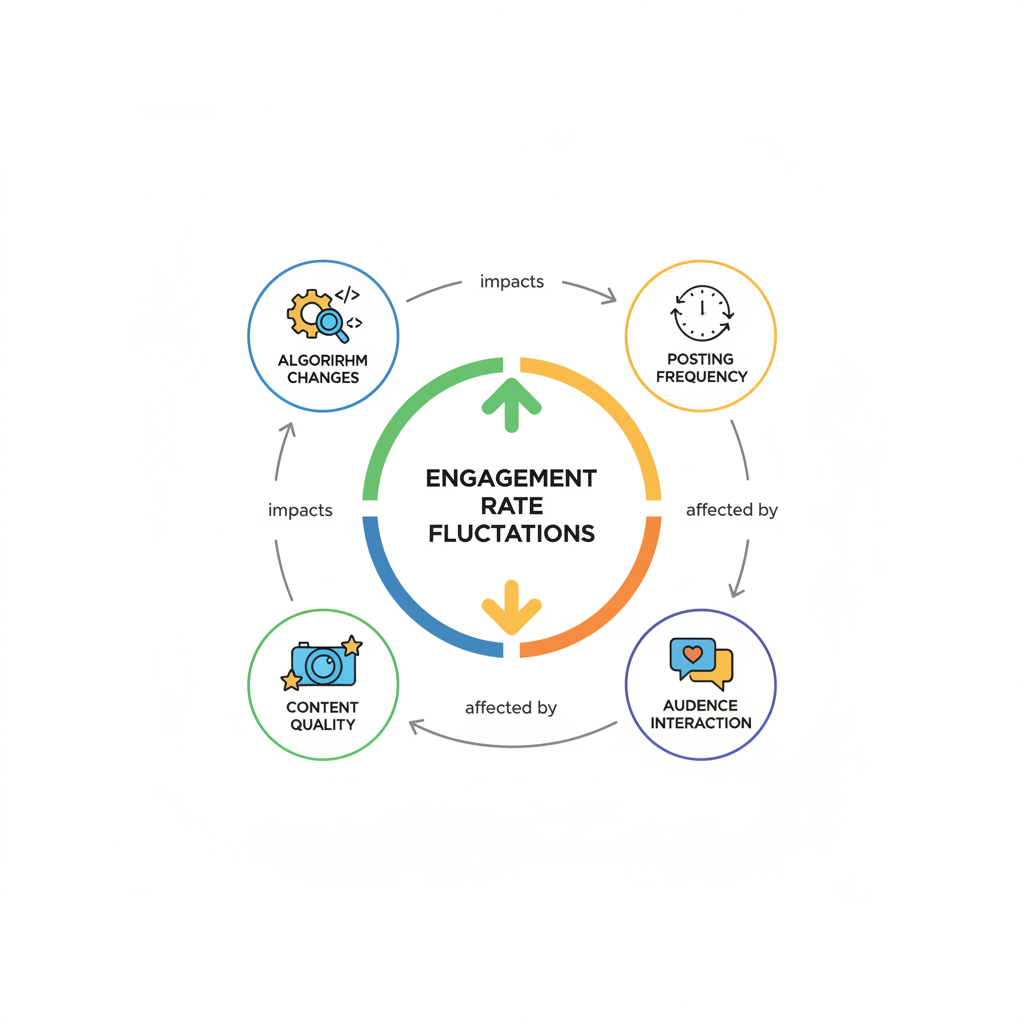
Factors Influencing Engagement Rate Fluctuations
In 2025, several macro and micro elements contribute to engagement rate changes:
- Algorithm Updates – Emphasis on authentic interaction, reduced visibility for clickbait.
- Content Trends – Short-form vertical video keeps dominating feeds.
- Audience Behavior – Shift toward relatable, niche-driven content.
- Global Events – Cultural moments and major events reshape conversation topics.
- Platform Features – Improved collaborative tools and threaded comments.
---
Organic Strategies to Boost Instagram Engagement
- Post Consistently – Align posting times with audience peak activity.
- Leverage Reels and Carousels – Favor formats proven to deliver higher engagement.
- Create Shareable Content – Include humor, quick educational tips, or inspiring visuals.
- Engage Back – Reply promptly to comments and direct messages.
- Cross-Promotion – Drive traffic from other social accounts to Instagram.
---
The Role of Hashtags, Keywords, and Captions
Hashtags remain impactful in 2025, but they work best when paired with keyword-rich captions. Captions should be:
- Relevant and descriptive
- Emotionally compelling to spark dialogue
- Built with micro-storytelling for depth
Pro Tip: Combine trending hashtags with niche-specific ones to maximize reach.
---
Audience Retention and Watch Time for Reels
Instagram’s reel algorithm rewards longer average watch times in 2025. Multiple plays or extended viewing beyond three seconds increases content visibility.
Optimization Tactics:
- Capture attention within the first 3 seconds
- Add subtitles for accessibility
- Maintain consistency in visual theme and tone
---
Measuring Engagement: Native vs Third-Party Tools
Native Analytics (Instagram Insights)
Pros:
- Free, built-in access to official metrics
- Real-time updates
Cons:
- Limited advanced reporting
- Restricted historical data windows
Third-Party Tools (Sprout Social, Hootsuite, Iconosquare)
Pros:
- Detailed cross-platform analytics
- Export-ready reporting
Cons:
- Subscription fees
- Minor metric variances from native data
---
Case Study: High-Engagement Brand Campaign
A sustainable fashion brand achieved a 7.2% engagement rate during a #WearYourValues campaign.
Success Drivers:
- Authentic storytelling with behind-the-scenes content
- Partnering with micro-influencers
- Encouraging user-generated posts
- Posting in sync with global sustainability events
Results: 38% spike in website visits and 12% follower growth in one month.
---
Pitfalls and Myths About Engagement Metrics
Myth: More followers guarantee higher engagement.
Reality: Engagement hinges on relevance, not size.
Myth: Engagement equals likes and comments.
Reality: Saves, shares, and watch time weigh heavily in 2025.
Pitfall: Chasing popular trends without audience fit leads to short-term gains only.
---
Monthly Checklist to Improve Engagement
January–March
- Audit and remove underperforming posts
- Trial new reel formats
April–June
- Collaborate with peers in your niche
- Experiment with carousels for deeper storytelling
July–September
- Host interactive live sessions
- Launch seasonal posting challenges
October–December
- Assess annual analytics data
- Develop next-year content trends strategy
---
Summary & Next Steps
Understanding Instagram average engagement rate 2025 benchmarks equips brands and creators with the insights needed to adapt and grow. Prioritize authentic engagement, experiment with content formats, and track metrics diligently for long-term success.
To elevate your Instagram strategy, start by benchmarking your account against industry averages, identify top-performing content types, and implement the monthly checklist above—then watch your engagement climb.