LinkedIn Benchmarks 2025: Engagement, Growth & Performance
Discover 2025 LinkedIn benchmarks for engagement, follower growth, and content performance, including industry-specific trends and optimal posting times.

Introduction to LinkedIn Benchmarks and Why They Matter in 2025
In 2025, LinkedIn is more than just a professional networking site—it’s a powerful ecosystem for B2B marketing, recruitment, thought leadership, and industry-specific engagement. For brands and professionals aiming to thrive, understanding LinkedIn benchmarks 2025 is essential. Benchmarks act as a performance compass, showing whether your results align with, exceed, or lag behind industry norms. In a competitive, algorithm-driven environment, they enable data-informed decision-making that fuels growth.
By aligning your LinkedIn KPIs to 2025 benchmarks, you can set ambitious yet realistic goals, adjust strategies with precision, and position yourself ahead of competitors.

---
Major LinkedIn Updates Impacting 2025 Benchmarks
LinkedIn’s pace of innovation means new benchmarks emerge every year. Notable updates in 2025 include:
- Algorithm Changes:
- Elevated visibility for meaningful interactions (quality comments and dialogue).
- Boosted reach for multi-format content such as video, carousels, and documents.
- Feature Releases:
- AI-assisted post drafting for company profiles.
- Advanced event analytics for attendee insights.
- Expanded LinkedIn Newsletters with push notifications for subscribers.
- Analytics Dashboard Upgrade:
- Real-time engagement breakdown.
- Benchmarks integrated directly into LinkedIn Analytics for easier tracking.
These updates redefine what "good performance" looks like, making regular benchmark comparison critical.
---
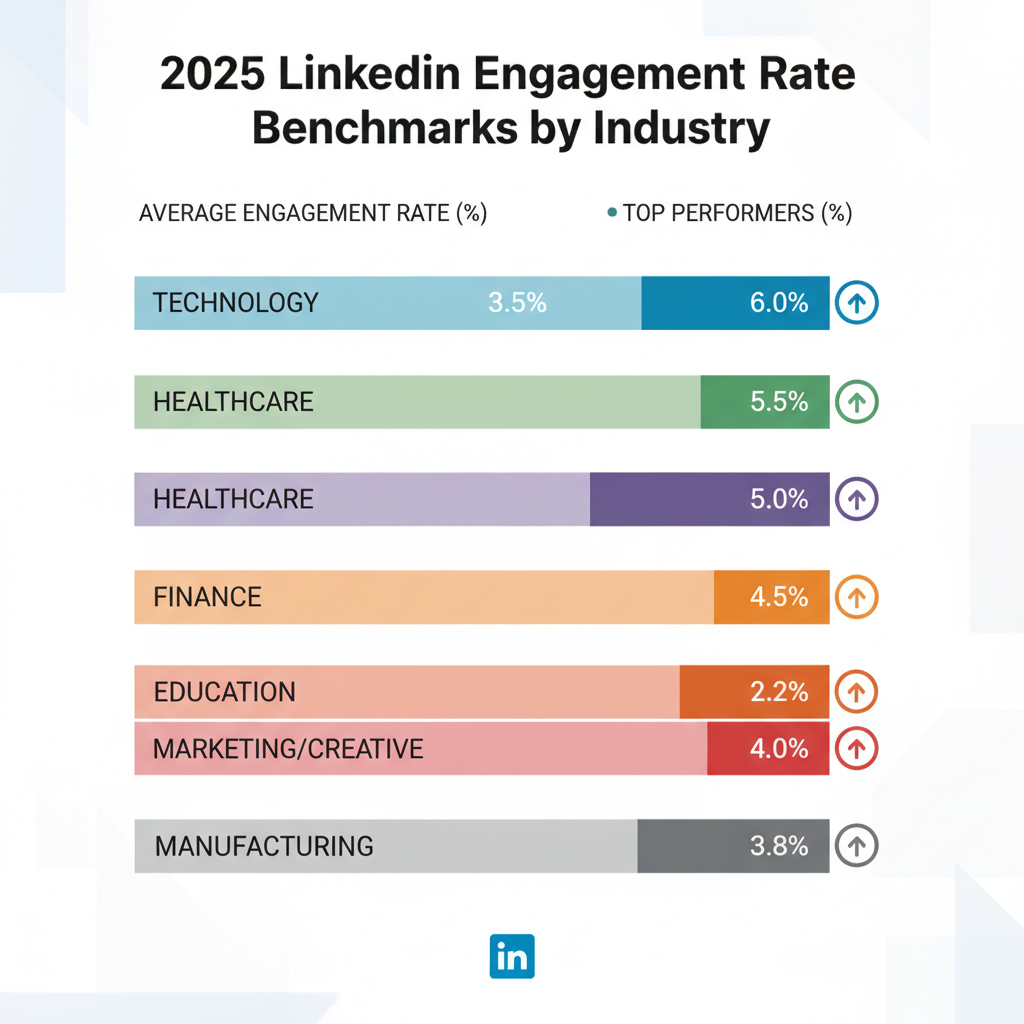
Engagement Rate Benchmarks by Industry
In 2025, engagement rate is calculated as:
Engagement Rate = (Total Interactions / Total Impressions) × 100Where interactions include likes, comments, shares, and reactions.
| Industry | Average Engagement Rate | Top Quartile Performance |
|---|---|---|
| Technology | 2.5% | 4.8% |
| Finance | 1.8% | 3.9% |
| Healthcare | 2.1% | 4.5% |
| Education | 3.0% | 5.2% |
| Marketing & Media | 3.5% | 6.1% |
Key Insight: Content combining expertise, story-driven narratives, and community interaction prompts frequently exceeds these benchmarks.
---
Follower Growth Rate Averages Across Industries and Company Sizes
LinkedIn follower growth rates in 2025 display clear differences by company size:
- Small businesses (<50 employees): ~3% monthly growth.
- Mid-sized companies (50–500 employees): ~2.4% monthly growth.
- Enterprise (500+ employees): ~1.8% monthly growth.
Sectors like EdTech, SaaS, and Digital Marketing lead the pack, propelled by consistent thought leadership content and employer branding campaigns.
---
Content Performance Benchmarks
Performance varies by content type in 2025:
| Content Type | CTR | Video Completion Rate | Document Download Rate |
|---|---|---|---|
| Link Posts | 1.9% | — | — |
| Native Video | 2.4% | 54% | — |
| Image Carousel | 2.8% | — | — |
| PDF/Document Uploads | 2.1% | — | 0.8% |
| Polls | 3.1% | — | — |
Note: Polls excel in engagement when tied to current, relevant industry discussions.
---
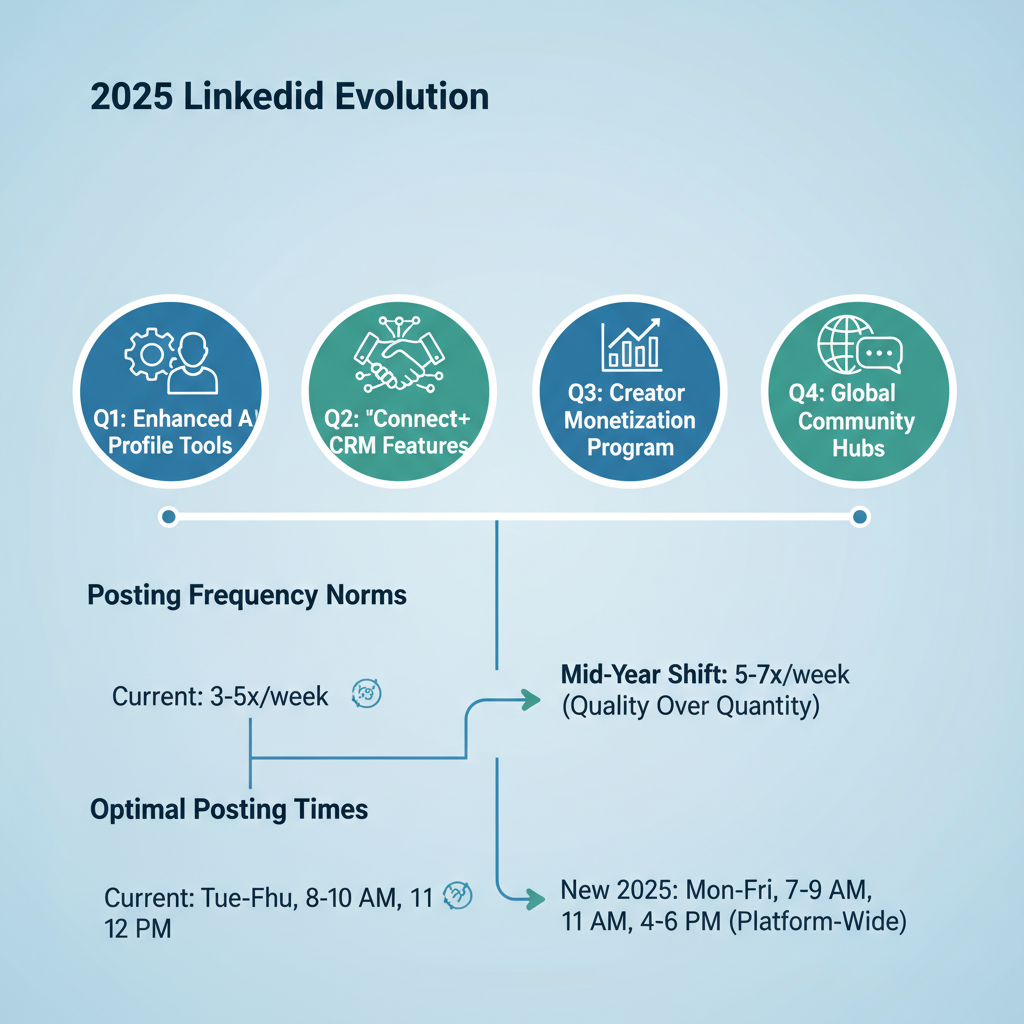
Posting Frequency Norms and Optimal Times in 2025
The updated algorithm favors consistent activity over high volume posting:
- Active company pages: 3–5 posts weekly.
- Optimal times:
- Tuesdays & Thursdays, 8–10 AM local time.
- Noticeable engagement decline after 3 PM.
For brands with global audiences, stagger posting by time zone to maximize visibility.
---
InMail and Connection Request Acceptance Benchmarks
Direct outreach remains pivotal for B2B networking:
| Metric | Benchmark 2025 |
|---|---|
| InMail Response Rate | 18% |
| Connection Request Acceptance (cold) | 25% |
| Connection Request Acceptance (warm) | 47% |
Personalized messages and shared communities/groups boost acceptance rates.
---
Employee Advocacy Benchmarks
In 2025, employee advocacy is a multiplier for reach:
- Share rate: 22% of employees actively share company updates.
- Amplification: Employee reshared posts achieve 3× more impressions.
- Highest engagement results from authentic, employee-generated thought leadership content.
---
Organic vs Paid Performance Benchmarks
Organic reach remains strong in certain sectors, but paid promotion delivers scalable outcomes.
| Performance Metric | Organic | Paid |
|---|---|---|
| Average CTR | 2.3% | 3.6% |
| Average Engagement Rate | 2.7% | 4.1% |
| Lead Conversion Rate | 0.9% | 1.8% |
Tip: Use organic thought leadership to warm audiences, then retarget with paid campaigns for higher ROI.
---
Tools and Methods for Measuring Your LinkedIn Performance Against Benchmarks
Track performance against LinkedIn benchmarks 2025 using:
- LinkedIn Analytics (with built-in benchmark comparison).
- Third-party analytics tools: Shield Analytics, Hootsuite, Sprout Social.
- Manual tracking: Export monthly CSV data, compare with industry sources.
- Implement KPI dashboards with automated benchmark alerts.
---
Actionable Strategies to Exceed 2025 LinkedIn Benchmarks
- Content Diversification: Use a mix of video, polls, documents, and carousels.
- Reactive Engagement: Reply to comments within one hour to gain algorithmic advantage.
- Employee Campaigns: Introduce gamification to encourage staff sharing.
- Hybrid Distribution: Blend organic content with paid retargeting.
- A/B Testing: Experiment with headlines, formats, and timing.
- Audience Segmentation: Create niche-specific content for targeted communities.
---
Conclusion and Key Takeaways
Success with LinkedIn benchmarks 2025 hinges on combining solid data analysis with agile strategy. By mastering platform updates, monitoring industry-specific averages, and applying integrated content and outreach tactics, professionals can exceed expectations.
Key takeaways:
- Keep pace with LinkedIn’s algorithm and feature rollouts.
- Compare your KPIs against industry-specific benchmarks regularly.
- Merge organic and paid approaches for sustainable growth.
- Harness employee advocacy for amplified credibility and reach.
Organizations that continually adapt won’t just meet benchmarks—they’ll set new industry standards.
---
Ready to outperform your LinkedIn goals in 2025? Start benchmarking today, refine your strategy, and watch your presence—and performance—soar.