LinkedIn Engagement Rate Benchmark and Strategies to Improve
Learn LinkedIn engagement rate benchmarks by sector, how to calculate them, and strategies to boost interaction for stronger professional impact.

Introduction to LinkedIn Engagement Rate Benchmarks
For brands and marketers, mastering the LinkedIn engagement rate benchmark is a key step toward maximizing visibility and impact on the platform. This metric measures how deeply your audience interacts with your posts — beyond mere impressions — and serves as a guide for evaluating strategy, content quality, and campaign success. Understanding benchmarks by industry allows you to set realistic goals, refine tactics, and build genuine connections with your professional network.
---
Understanding LinkedIn Engagement Rate and Why It Matters
LinkedIn engagement rate measures how effectively your content resonates with your audience. For marketers, it is a crucial metric indicating not just reach but depth of interaction — how much people actually care about, react to, and amplify your message.
High engagement is often linked to stronger brand perception, more qualified leads, and meaningful community growth. If you nail the engagement rate, you’re not simply gaining followers; you’re earning influence in your niche.
---
How Engagement Rate Is Calculated
LinkedIn engagement rate is generally calculated using the formula:
Engagement Rate (%) = ((Likes + Comments + Shares) ÷ Impressions) × 100Where:
- Likes: Users who appreciated your post.
- Comments: Users who engaged in conversation.
- Shares: Users who spread your post to their network.
- Impressions: Total number of times your post appeared in feeds.
A consistent, accurate calculation gives you the ability to compare across posts, campaigns, and timeframes.
---
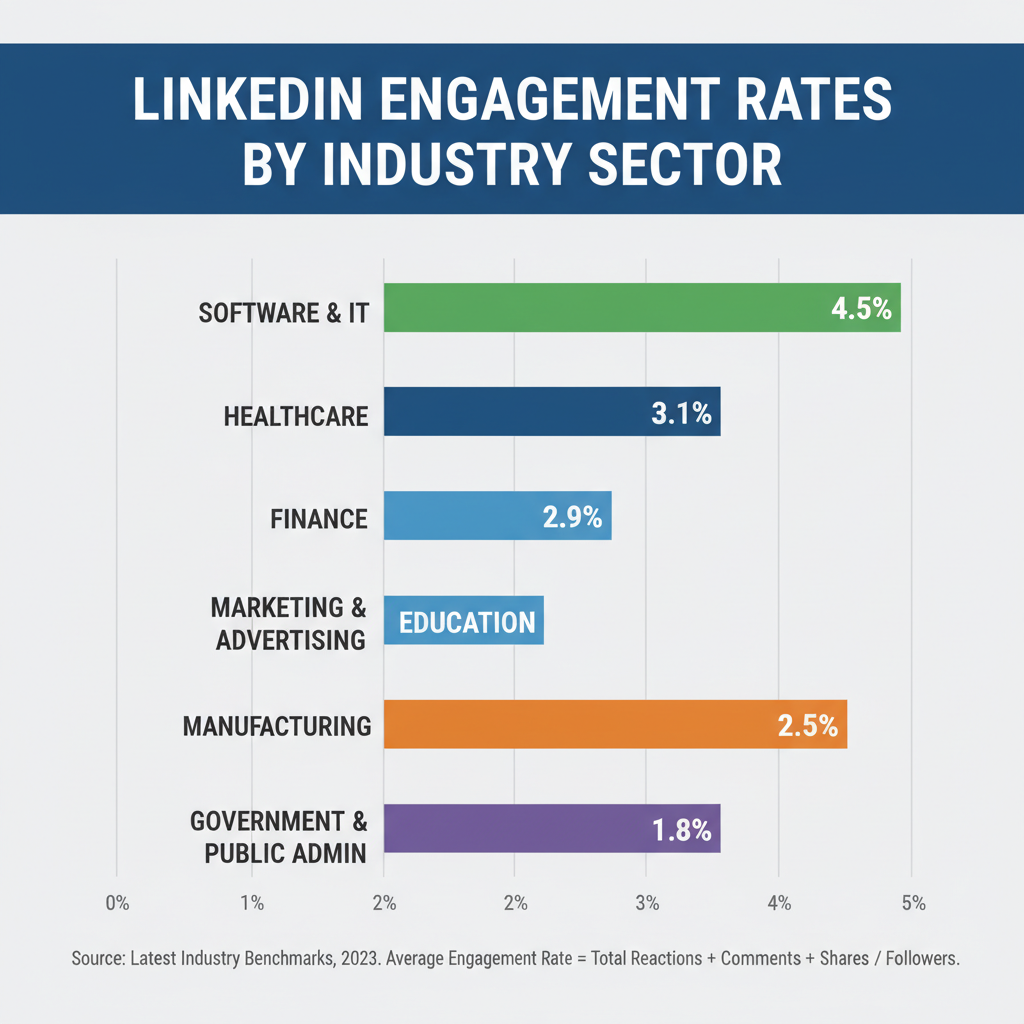
Latest Industry Benchmarks by Sector
Industry benchmarks provide context for your numbers. A 2% engagement rate can be stellar in one sector and mediocre in another. Based on aggregated 2023–2024 LinkedIn marketing reports, here’s a comparative view:
| Sector | Average Engagement Rate (%) | Notes |
|---|---|---|
| B2B Services | 0.80 | Typically longer sales cycle; niche audience |
| Technology | 1.20 | Product demos & innovation news drive higher rates |
| Recruiting & HR | 1.50 | Job postings & career advice perform well |
| Thought Leadership | 2.30 | Engaging opinions & trend analysis spark discussions |
These numbers are not rules but reference points to evaluate your own performance.
---
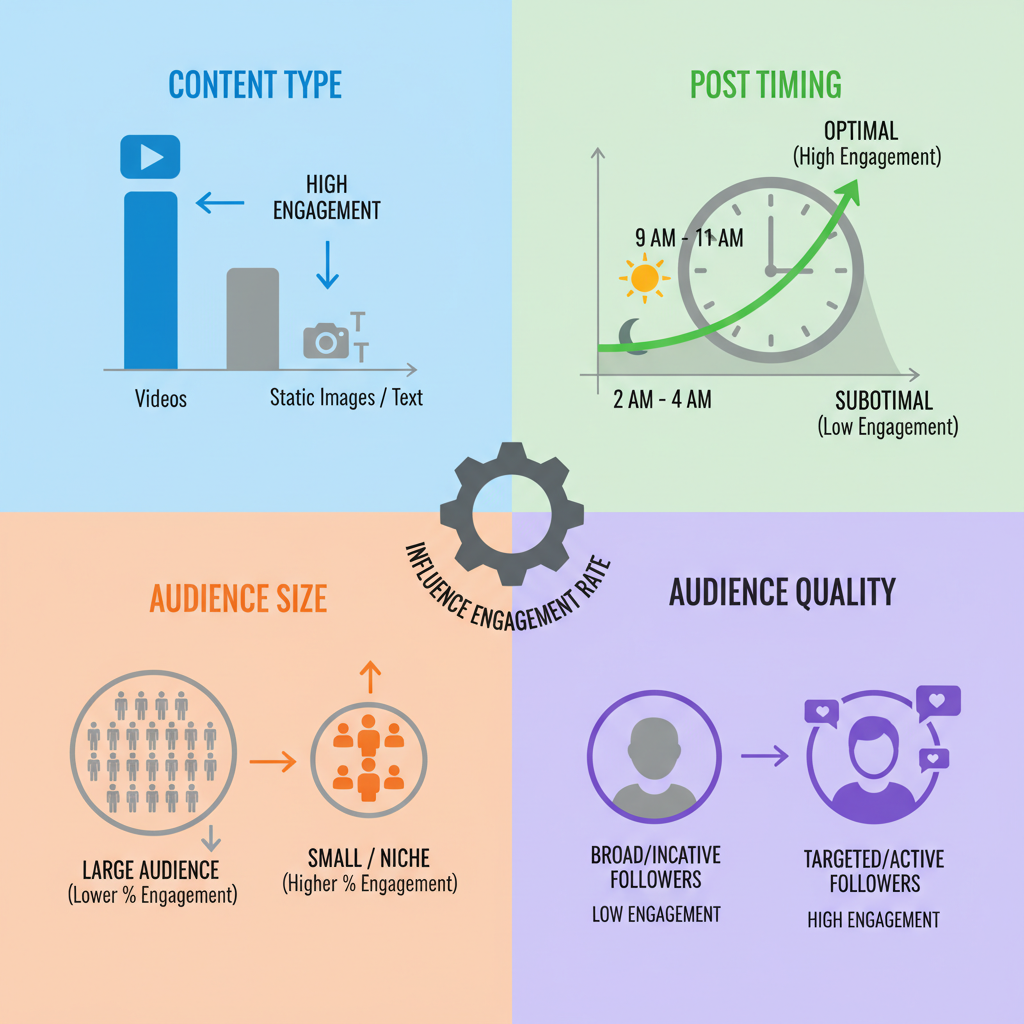
Factors Influencing Engagement Rate
Several elements determine whether a post will outperform or underperform your baseline:
1. Content Type
Video, documents, polls, carousel posts, and native articles each have different engagement dynamics. Native video often fosters higher retention, while carousel PDFs encourage multi-slide interaction.
2. Post Timing
Your audience’s active hours directly influence impressions and subsequent engagement. For many sectors, weekdays between 8–10 AM and 4–6 PM perform best.
3. Audience Size & Quality
A large but unengaged audience can dilute your engagement rate, while a smaller highly targeted audience can lift it.
4. Relevance & Trend Alignment
Posts tied to industry trends or hot topics capture more interest than generic updates.
---
Sponsored vs. Organic Post Engagement
Sponsored posts (LinkedIn Ads) place your content in feeds beyond your followers. While they increase impressions, engagement rate can vary:
| Type | Average Engagement Rate (%) | Cost Consideration |
|---|---|---|
| Organic | 1.50 | No direct cost; relies on algorithmic reach |
| Sponsored | 1.10 | Budget-dependent; reaches new audiences |
Sponsored content often generates broader awareness but may have slightly lower rates because audiences are less familiar with the brand.
---
Tools and Analytics for Tracking LinkedIn Engagement Rate
Tracking accurately helps you iterate and improve. Popular tools and methods include:
- LinkedIn Analytics (native): Shows impressions, clicks, reactions, comments, shares per post.
- Shield App: Offers detailed engagement metrics per post and trends over time.
- Hootsuite / Sprout Social: Integrates LinkedIn tracking with multi-platform dashboards.
- Manual tracking in spreadsheets: For custom calculations and long-term trend analysis.
Tip: Always align your tracking period with campaign timelines to avoid skewed numbers.
---
Proven Strategies to Increase Engagement
- Storytelling – Share personal or customer stories that humanize your brand. Emotional resonance drives comments.
- Native Video – Post videos directly to LinkedIn instead of external links. LinkedIn prioritizes native formats.
- Polls & Questions – Encourage audience participation through quick voting. Polls lower friction for engagement.
- Carousel Documents – Use PDF carousels to provide step-by-step guides or visual narratives.
- Consistent Posting Cadence – Keep a predictable rhythm so followers know when to expect new content.
Example carousel idea:
Title Slide: "5 LinkedIn Engagement Hacks"
Slide 1: Post stories
Slide 2: Use polls
Slide 3: Engage with comments
Slide 4: Test visuals
Slide 5: Recap
---
A/B Testing to Optimize Engagement
A/B testing allows you to compare variations and see which resonates more:
Variables to Test
- Headlines: Try curiosity-driven vs. straightforward titles.
- Visuals: Compare infographics vs. lifestyle images.
- Posting Frequency: Analyze if daily posting outperforms weekly updates.
Process Example
- Create two versions of a post with different headlines.
- Publish them at similar times and days over two weeks.
- Measure engagement rate for each variant.
- Select the winning approach for future campaigns.

---
Employee Advocacy and Its Impact
When employees share and engage with company posts, organic reach expands exponentially. Advocacy enhances the network effect:
- Boost impressions: Content surfaces in their connections’ feeds.
- Increase credibility: People trust posts shared by known individuals more than corporate pages.
- Improved engagement rates: Advocacy often turns passive viewers into active participants.
Best practices:
- Provide employees with ready-to-share content.
- Recognize advocates through internal communications.
- Make advocacy voluntary, not mandated.
---
Setting Realistic Goals Based on Benchmarks
Benchmarks reveal what’s achievable. If your sector average is 1.2%, aiming for 3% immediately may be unrealistic. Instead:
- Start with baseline measurement: Know your current engagement rate over the past 3 months.
- Set incremental targets: Aim to increase by 0.2–0.3% in the next quarter.
- Tie goals to strategies: Align tactics like video posting to specific rate improvements.
- Review quarterly: Compare against industry averages and adjust strategies.
Goal-setting example:
| Period | Current Rate (%) | Target Rate (%) | Strategy Focus |
|---|---|---|---|
| Q1 | 1.20 | 1.40 | Increase native video content |
| Q2 | 1.40 | 1.60 | Add polls twice monthly |
| Q3 | 1.60 | 1.80 | Launch employee advocacy program |
---
Summary
Knowing your LinkedIn engagement rate benchmark provides the clarity to evaluate performance and plan measurable growth. From calculation formulas to industry-specific averages, timing strategies, and employee advocacy, each element contributes to a stronger LinkedIn presence. Keep testing, analyzing, and refining — and you’ll steadily increase your engagement while building meaningful professional relationships.
Ready to elevate your LinkedIn strategy? Start implementing these proven tactics today and track your progress against your sector benchmarks for consistent improvement.