Load Balancing Monitoring Group: Multi-Service Health Checks for High-Availability Applications
Introduction
Modern applications are no longer monoliths — they are complex, distributed systems where availability depends on multiple independent components working together seamlessly.
A web server might be running, but if its database connection is down or the authentication service is unresponsive, the whole application becomes unhealthy. Relying on a single health check is like ignoring a flat tire because the “check engine” light isn’t on — the engine may be fine, but you’re still stuck.
As complexity increases, so does the definition of “healthy.” Many customers — from startups to enterprises — need multi-service validation before routing traffic. A typical scenario might involve ensuring that both an API gateway and the `'/login'` service are responsive before sending users there.
Until now, achieving this often meant building custom synthetic services to aggregate checks, increasing operational overhead and creating another point of failure.
---
Announcing Monitor Groups
Today we’re introducing Monitor Groups for Cloudflare Load Balancing.
What it does:
- Combines multiple health monitors into one logical entity.
- Lets you mark critical components.
- Produces an aggregated health score for smarter failover decisions.
Key Benefits:
- No need for custom aggregation services.
- More accurate view of real application availability.
- API access for Enterprise; Dashboard access coming soon to all users.
---
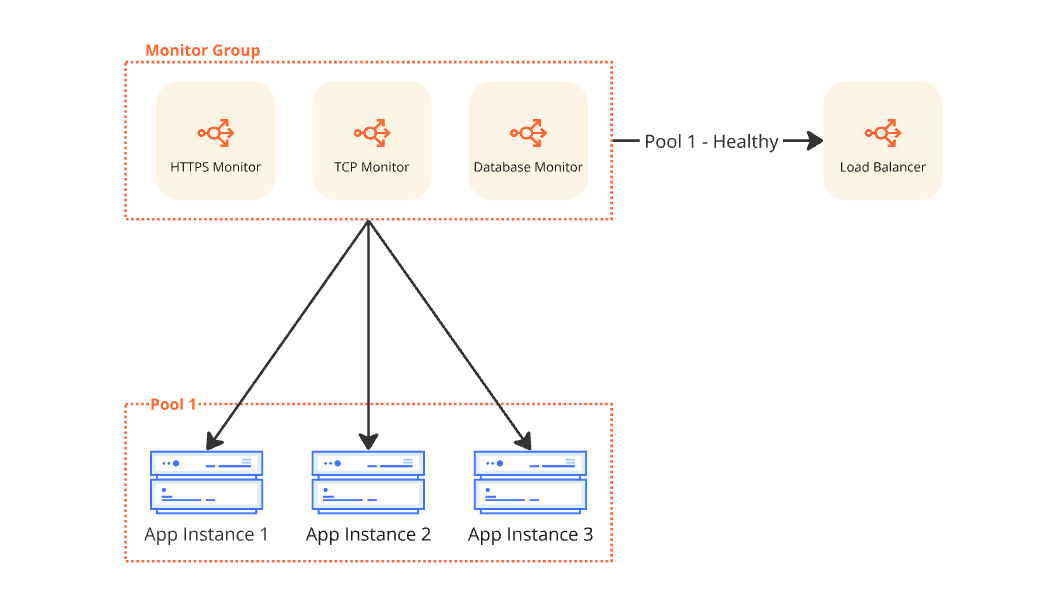
How Monitor Groups Work
A Monitor Group acts as a superset of individual monitors.
Once created, monitors can be bundled into one unified unit.
When attached to a pool, endpoint health is determined based on the aggregated results of all enabled monitors in the group. These are defined in the `members` array.
{
  "description": "Test Monitor Group",
  "members": [
    {
      "monitor_id": "string",
      "enabled": true,
      "monitoring_only": false,
      "must_be_healthy": true
    },
    {
      "monitor_id": "string",
      "enabled": true,
      "monitoring_only": false,
      "must_be_healthy": true
    }
  ]
}
Key Properties
- `must_be_healthy` — Critical Monitors:
- Marks a monitor as critical. If it fails, the endpoint is flagged unhealthy immediately.
- `monitoring_only` — Observational Probes:
- Collects alerts/data without affecting health status or traffic steering. Good for testing or monitoring non-critical dependencies.
- Quorum-Based Health:
- If no critical monitor fails, health is decided by the majority of active monitors. An endpoint becomes globally unhealthy only if more than 50% of assigned monitors report it as unhealthy.
You can add up to five monitors to a group.

---
Distributed Health Monitoring
Global Reach
Thanks to Cloudflare’s global network, health checks can run from 300+ cities worldwide.
- Use All Datacenters for maximum coverage, or
- Select strategically diverse regions for efficiency.
This reduces origin workload and minimizes false positives caused by local network issues.
Global Latency in Dynamic Steering
When using Dynamic Steering with Monitor Groups:
- Latency = average Round Trip Time of all active, non-monitoring-only members.
- Routing decisions reflect the collective performance of all critical components, not just one service.
---
Health Aggregation: Example
Scenario Components
- Public `/health` endpoint (critical)
- TCP port 3000 connectivity (non-critical)
- Database dependency (non-critical, monitored securely via Cloudflare Tunnel)
Health Check Regions:
- Western North America (3 DCs)
- Eastern North America (3 DCs)
Process
- Each data center reports endpoint health individually.
- If the critical monitor fails → status = DOWN immediately.
- Otherwise → majority of remaining monitors decides per-DC status.
- Global health = majority status across all DCs.
Sample Result:
- 6 DCs checked → 1 DOWN (critical monitor failed), 5 UP.
- Global Result: 83% UP → endpoint considered globally healthy.
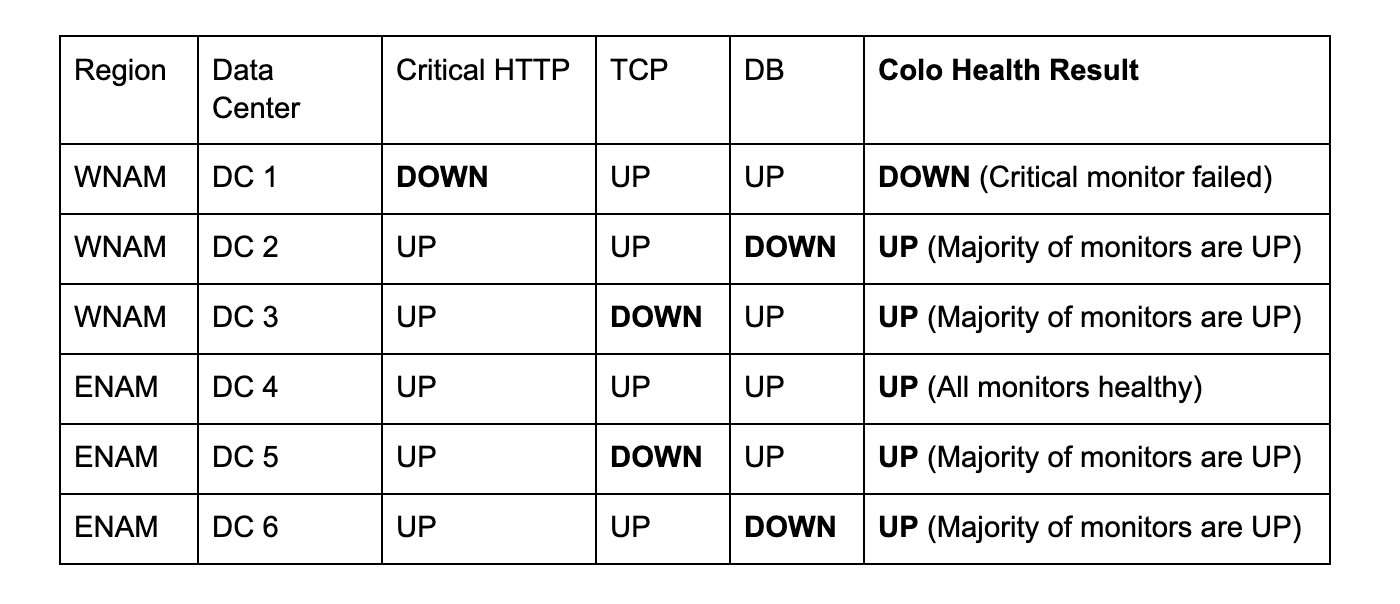
This multi-layered quorum system provides resilience by basing failover on geographically distributed consensus.
---
Getting Started
Availability:
- API access for Enterprise Cloudflare Load Balancing users.
- Coming soon to Dashboard for all users.
API: Create a Monitor Group
POST accounts/{account_id}/load_balancers/monitor_groups
{
  "description": "Monitor group for checkout service",
  "members": [
    {
      "monitor_id": "string",
      "must_be_healthy": true,
      "enabled": true
    },
    {
      "monitor_id": "string",
      "monitoring_only": false,
      "enabled": true
    }
  ]
}
Tip: Attach the group to a pool by referencing its ID in the `monitor_group` field.
📄 Developer docs: Monitor Groups
📄 API reference: Create Monitor Group
---
What’s Next
We’re building more flexible:
- Role-based access control (RBAC)
- Load-based load balancing
- Full Dashboard integration for Monitor Groups.
---
Bonus: AI-Powered Workflows
Operational insights can be shared and monetized via platforms like AiToEarn官网:
- Open-source global AI content monetization.
- Simultaneous publishing to Douyin, Kwai, WeChat, Bilibili, Rednote, Facebook, Instagram, LinkedIn, Threads, YouTube, Pinterest, X (Twitter).
- Integrated AI tools, analytics, and AI模型排名.
Just like Monitor Groups aggregate multi-source health signals, AiToEarn aggregates multi-platform content workflows — enabling creators and teams to focus on core work while automation handles the complexity.
---
✅ Key Takeaway:
Monitor Groups help teams simplify, consolidate, and strengthen health checks across distributed systems — making failover decisions more accurate and resilient. And the same principles of aggregation and automation can empower global content operations.