Instagram Reels Analytics Guide to Increase Engagement
Learn how to use Instagram Reels analytics to track key metrics, boost engagement, improve audience retention, and identify trends for growth.
Introduction to Instagram Reels Analytics and Why They Matter
Instagram Reels analytics are essential for creators, brands, and marketers aiming to maximize the reach, engagement, and conversion potential of their short-form video strategy. In today’s competitive social media landscape, it’s not enough to simply create visually appealing and trendy Reels — you need quantifiable insights to understand what works best for your audience.
By analyzing metrics such as reach, retention, and engagement, you can refine content choices, improve posting schedules, and boost overall visibility. This step-by-step guide to Instagram Reels analytics covers how to access data, interpret it effectively, spot trends, and use findings to drive consistent growth.

---
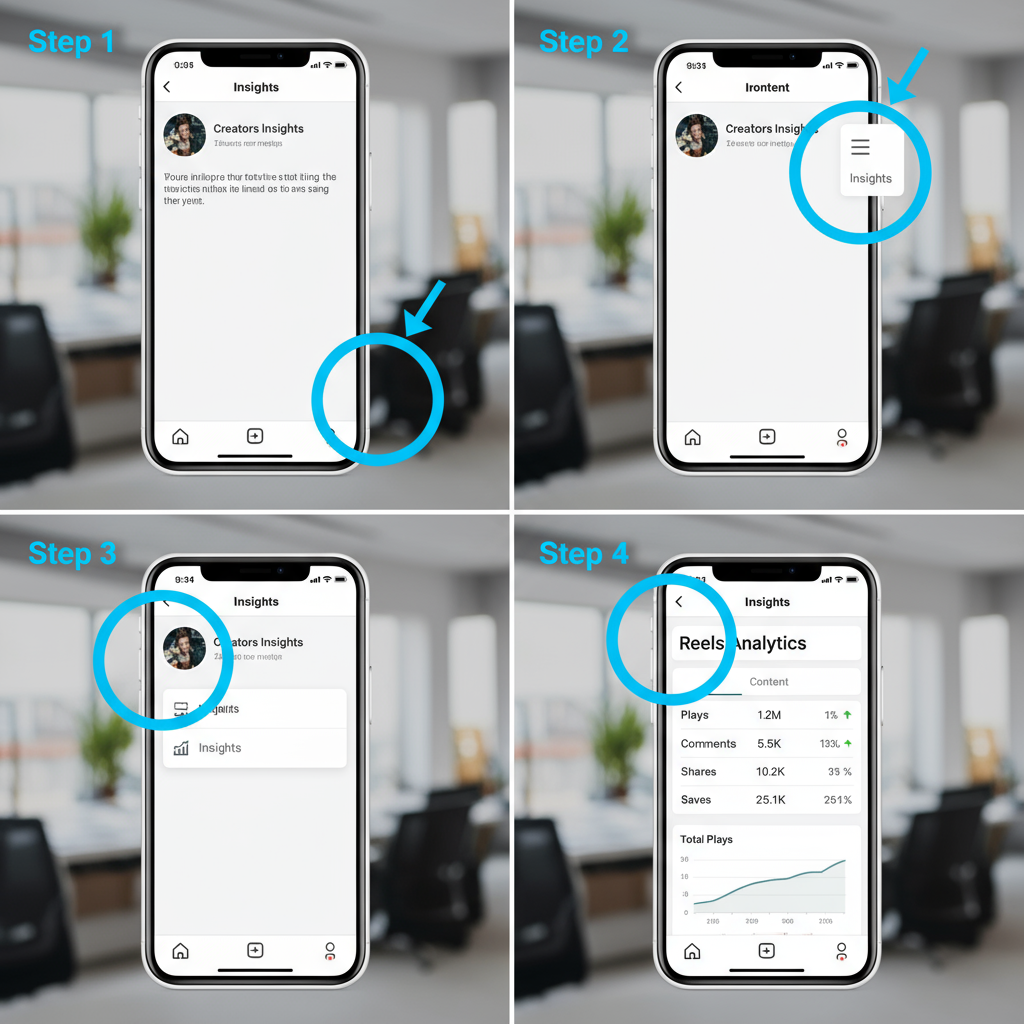
How to Access Reels Analytics in the Instagram App
To view analytics, you must have a Business or Creator account. Once set up, follow these steps:
- Switch to a Professional Account
- Go to Settings → Account → Switch to Professional Account.
- Open Your Profile and tap the menu (three horizontal lines) in the top right corner.
- Select Insights.
- Navigate to Content You Shared and open the Reels section.
- Tap a specific Reel to view detailed stats like reach, plays, and interactions.
Quick Access Method: From your profile, choose any Reel → tap the three dots → select View Insights.
---
Key Metrics to Track in Instagram Reels Analytics
Inside Insights, you’ll find several metrics that reveal content performance. Understanding each helps optimize your creative process.
| Metric | Definition | Why It Matters |
|---|---|---|
| Plays | Total number of times your Reel was played. | Indicates overall consumption and potential virality. |
| Reach | Unique accounts that viewed your Reel. | Measures discoverability and audience size. |
| Likes | Number of likes received. | Signals direct audience approval. |
| Comments | The number of user comments. | Highlights engagement depth and interaction quality. |
| Shares | Instances of your Reel being sent to others or shared to Stories. | Reflects shareability and network amplification. |
| Saves | Number of times saved to collections. | Demonstrates perceived long-term value. |
---
Understanding Audience Retention and Watch Time for Reels
Beyond surface-level engagement, audience retention shows how long viewers remain engaged.
Important points about retention and watch time:
- A steep drop in the first 3 seconds often means you need a stronger hook.
- Longer average watch times can boost Reels in Instagram’s algorithm.
- Replays inflate total plays but can distort average watch time.
Use retention graphs in Insights to pinpoint drop-off moments and adjust pacing or format.
---
Analyzing Content Performance to Identify Trends
Data analysis over time reveals patterns that inform content creation:
- Look at top-performing Reels: What themes, audio tracks, and camera angles recur?
- Compare day and time performance for scheduling optimization.
- Track hashtags that reliably increase reach.
Pro tip: Export your Instagram analytics to a spreadsheet monthly for easier trend visualization.
---
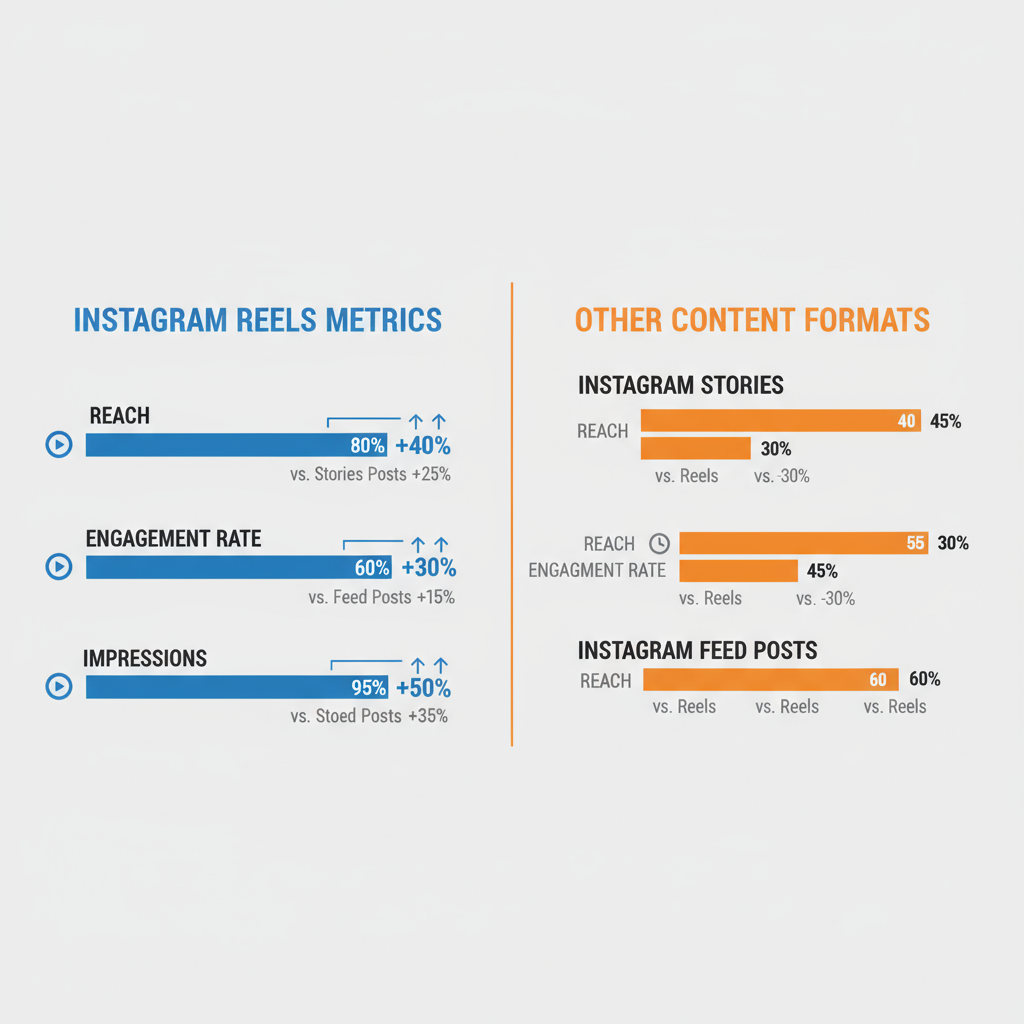
How to Compare Reels Metrics to Other Content Formats
Cross-comparing performance with feed posts, Stories, IGTV, or Lives helps allocate resources effectively:
- Reels outperform posts in reach: Double down on Reels while supporting them with static posts.
- Stories see more direct replies: Use stories to further the conversation sparked by Reels.
- IGTV generates deeper watch sessions: Create multi-part Reels leading to IGTV.
---
Tools Beyond Instagram for Deeper Analytics Insights
Third-party social media analytics platforms can give broader, long-term insights:
- Iconosquare — Comprehensive metrics dashboards and reporting options.
- Later Analytics — Scheduling and visual performance reports.
- Sprout Social — Competitor tracking and engagement analysis.
They often store more than Instagram’s standard 90-day history for ongoing comparisons.
---
Tips to Improve Reels Performance Based on Analytics
Once you’ve gathered your data, apply it proactively:
- Improve Initial Seconds: Retention metrics reveal the need for dynamic beginnings.
- Mind the Length: 7–15 seconds is often the sweet spot for completion rates.
- Post When Followers Are Active: Match your content to audience activity peaks.
- Use Viral Sounds: Integrate trending audio identified in top-performing Reels.
- Build on Winning Formats: Turn successful ideas into themed series.
---
Setting Benchmarks and Goals for Reels Growth
Setting realistic goals tied to analytics keeps growth measurable:
- Boost average reach by 25% in 90 days.
- Increase saves from 50 to 75 per Reel within one quarter.
- Improve end-to-end watch rates by 10% over three months.
Regularly revisit and revise benchmarks to stay relevant.
---
Common Mistakes to Avoid with Instagram Reels Analytics
Prevent these data missteps:
- Focusing on vanity metrics only: Likes are nice, but retention matters for algorithm reach.
- Expecting immediate results: Allow enough time to observe trends.
- Ignoring anomalies: In-depth review of viral spikes reveals repeatable tactics.
- Over-generalizing: Segment data by audience demographics.
---
Case Study: Using Analytics to Build a High-Performing Reel Strategy
A boutique fashion brand sought higher engagement and conversions. Over two months, analytics revealed:
- Behind-the-scenes tailoring clips drove 40% higher watch time.
- Trending audio increased shares by 25%.
- Thursday 7 PM posts had maximum reach.
Strategy shift: A Thursday-night tailoring series using popular sounds.
Outcome: Average reach doubled, and direct sales inquiries rose by 18% within 6 weeks.
---
Final Checklist for Ongoing Instagram Reels Analytics Tracking
Use this weekly checklist to maintain a data-driven approach:
- Access and log metrics weekly.
- Track key stats: plays, reach, likes, comments, shares, saves.
- Review watch time and retention graphs for drop-off points.
- Benchmark against other formats.
- Note trends in topics, style, and timing.
- Integrate third-party tools for depth.
- Update growth goals quarterly.
- Avoid overreacting to short-term spikes or dips.
---
By making Instagram Reels analytics a central part of your content strategy, you turn social posting from guesswork into precision marketing. Consistent monitoring and data-based tweaks give you the edge to grow reach, boost engagement, and convert viewers into loyal followers. Start tracking today, and build your next viral Reel with confidence.