Social Media Dashboard Analytics Guide for Marketers
Learn how to use social media dashboard analytics to track KPIs, compare top tools, set goals, and segment audiences for better marketing results.
Social Media Dashboard Analytics Guide for Marketers
In today’s competitive digital marketing landscape, social media dashboard analytics are essential for gaining real-time insights, optimizing campaigns, and effectively communicating performance to stakeholders. This comprehensive guide explains what social media dashboard analytics are, why they matter, how to use them efficiently, and the proven practices marketers employ to turn raw numbers into impactful strategies.

---
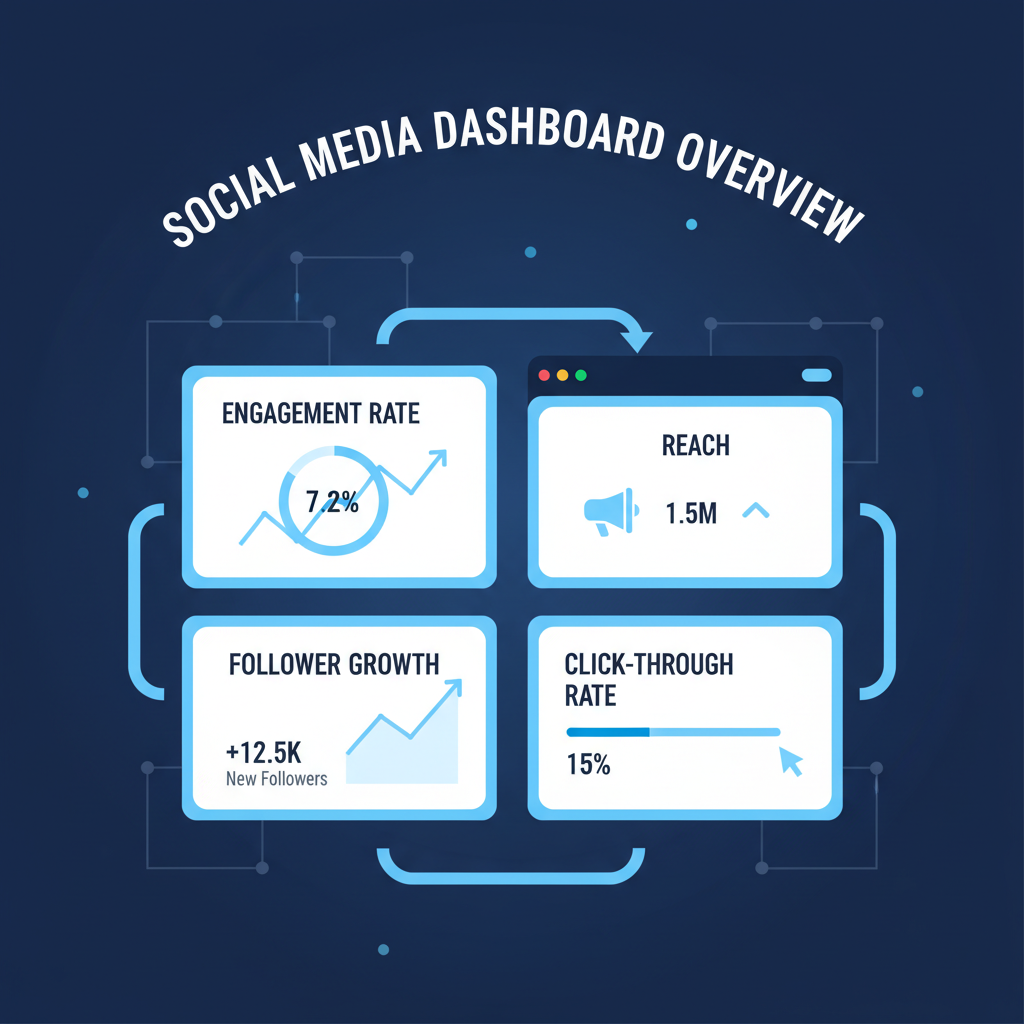
What Are Social Media Dashboard Analytics?
Social media dashboard analytics provide a consolidated, visual representation of metrics from various social platforms in one interface. They enable marketers to:
- Monitor multiple social networks from a single view
- Identify behavioral patterns and trends efficiently
- Make informed, data-driven decisions in real time
These dashboards simplify complex datasets into understandable visuals and KPIs, improving collaboration between teams and enhancing agility in campaign strategy.
---
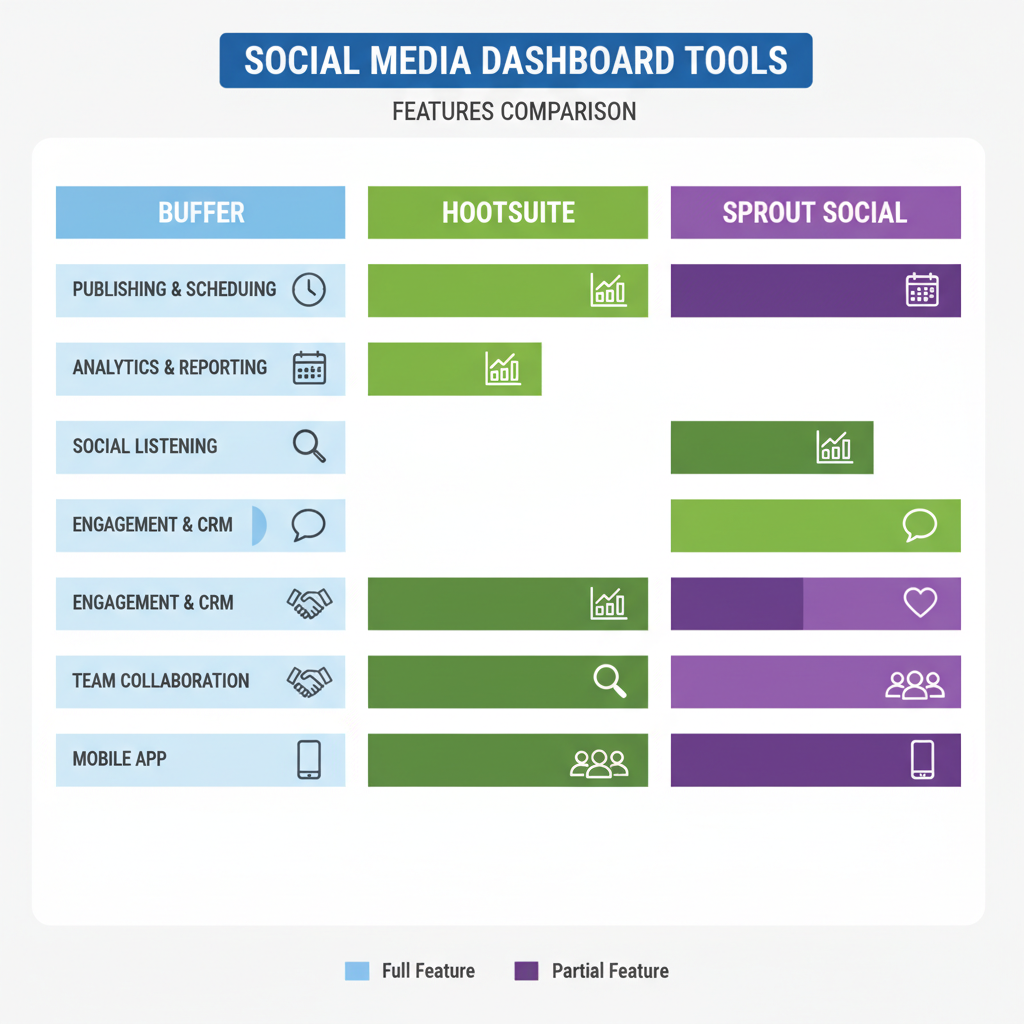
Comparing Top Dashboard Tools
Choosing the right analytics platform is critical for marketing success. Below is a comparison of some leading social media dashboard tools.
| Tool | Key Features | Pricing | Integrations |
|---|---|---|---|
| Hootsuite | Multi-platform management, scheduled posts, detailed reports | From $49/month | Facebook, Instagram, Twitter, LinkedIn, YouTube |
| Sprout Social | Advanced analytics, CRM integration, team collaboration | From $249/month | All major social platforms, Google Analytics |
| Buffer Analyze | User-friendly charts, engagement insights, audience growth tracking | From $35/month | Facebook, Instagram, Twitter, LinkedIn |
| Socialbakers | AI-powered insights, competitor analysis, flexible reporting | Custom pricing | Facebook, Instagram, Twitter, LinkedIn, YouTube |
---
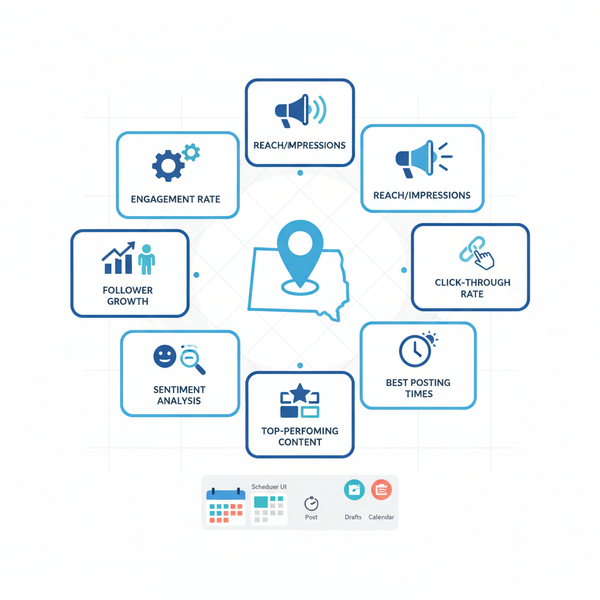
Key Metrics to Track
Every marketer should monitor key social media metrics to gauge campaign health:
- Engagement Rate: Measures user interaction relative to total reach
- Reach: The number of unique users who saw your content
- Impressions: Total number of views, including repeated views
- Click-Through Rate (CTR): Percentage of clicks against impressions
Tracking these metrics ensures your content resonates with your target audience and aligns with your objectives.
---
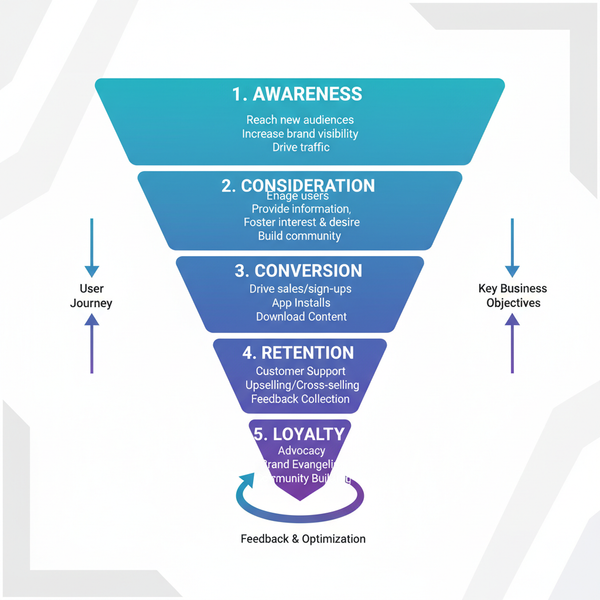
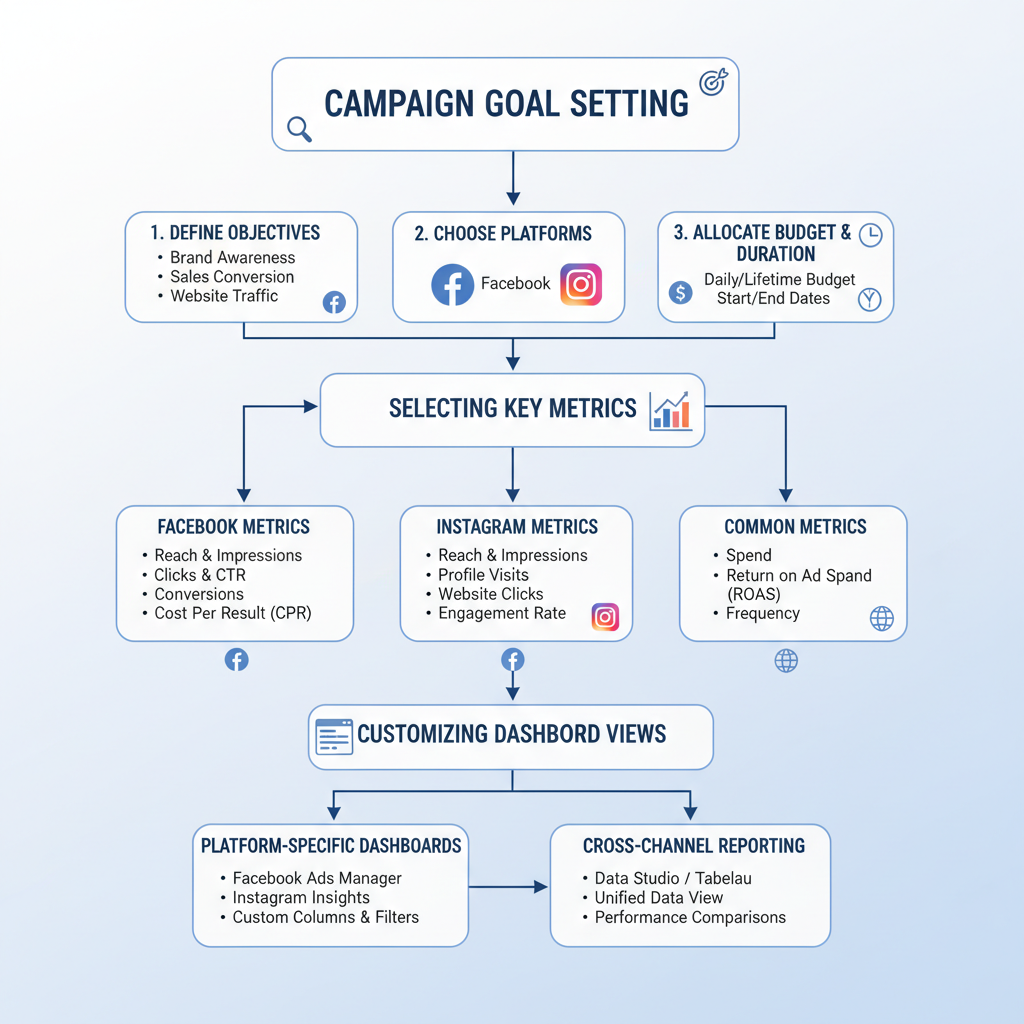
Setting Clear Campaign Goals
Analytics are most useful when tied to defined goals. Important goal-setting steps include:
- Objective: Identify primary aim—brand awareness, conversions, engagement
- Target Audience: Specify details—age, demographics, interests
- Timeline: Define campaign duration and seasonal relevance
- KPIs: Select metrics that align with objectives—engagement rate, lead volume, site traffic
This alignment ensures dashboard insights translate to meaningful outcomes.
---
Customizing Dashboards for Different Platforms
Each social platform offers unique engagement opportunities. Customize dashboards accordingly.
Track likes, shares, comment sentiment, and audience demographics.
Include story views, saves, profile visits, and hashtag performance.
Focus on retweets, mentions, and link click-through rates.
Measure post engagement, follower growth, and clicks on job posts or company updates.
---
Segmenting Data by Audience Demographics and Behavior
Audience segmentation reveals which groups drive the most engagement. Segment by:
- Age range
- Gender
- Interests and affinities
- Geographic location
- Device usage
- Engagement frequency
Example: Younger audiences may respond better to Instagram stories, while older demographics engage more on LinkedIn.
---
Interpreting Trends and Spotting Anomalies
Trend analysis helps track campaign progression over time. Look for:
- Gradual changes in reach indicating growth or decline
- Sharp spikes in engagement revealing viral content
- Drops in CTR hinting at ineffective calls-to-action
Identifying anomalies early allows corrective action before performance deteriorates.
---
Reporting Best Practices
Dashboards make reporting simple, but effectiveness depends on presentation. Best practices include:
- Using clear visuals like line graphs and pie charts
- Presenting both short and long-term data
- Explaining causes behind metric changes
- Highlighting successes alongside improvement areas
- Adapting report formats for executives versus technical teams
---
Common Mistakes in Social Media Analytics
Avoid these frequent errors:
- Tracking too many metrics: Focus on KPIs relevant to goals
- Ignoring platform-specific differences: Metrics vary by channel
- Overlooking external factors: Seasonality and trending topics affect results
- Failure to act on insights: Data must guide actions
---
Case Study: Dashboard Optimization Results
A mid-sized e-commerce retailer transitioned from manual spreadsheets to a tailored Sprout Social dashboard. By setting defined goals and segmenting audiences:
- Engagement rate rose by 42% within three months
- CTR improved from 1.8% to 3.4%
- Reporting time dropped by 70%
- Top posts were amplified via targeted ads, boosting ROI
This shift streamlined workflow and improved overall marketing effectiveness.
---
Ongoing Monitoring and A/B Testing
Maintaining dashboard health is continuous. Combine monitoring with A/B testing to refine campaigns:
- Experiment with headlines, creatives, and posting times
- Use analytics to identify winning variations
- Adapt strategies based on test results
Regular testing ensures campaigns remain fresh and competitive.
---
Conclusion
Mastering social media dashboard analytics transforms marketing from guesswork to precise, data-driven execution. By understanding metrics, defining goals, customizing dashboards for each platform, segmenting audience data, and spotting trends, marketers can maximize performance and ROI. Avoid common pitfalls, report with clarity, and commit to constant testing to maintain a competitive edge.
Dashboards are more than data visualization—they are vital tools for creating strategic, measurable, and ongoing marketing success. Ready to elevate your campaigns? Start optimizing your dashboard today and turn insights into impactful results.