Twitter Account Analytics Guide for Measurable Growth
Learn how to use Twitter analytics to track engagement, measure follower growth, and identify the best posting times for measurable audience growth.
Introduction to Twitter Analytics for Growth
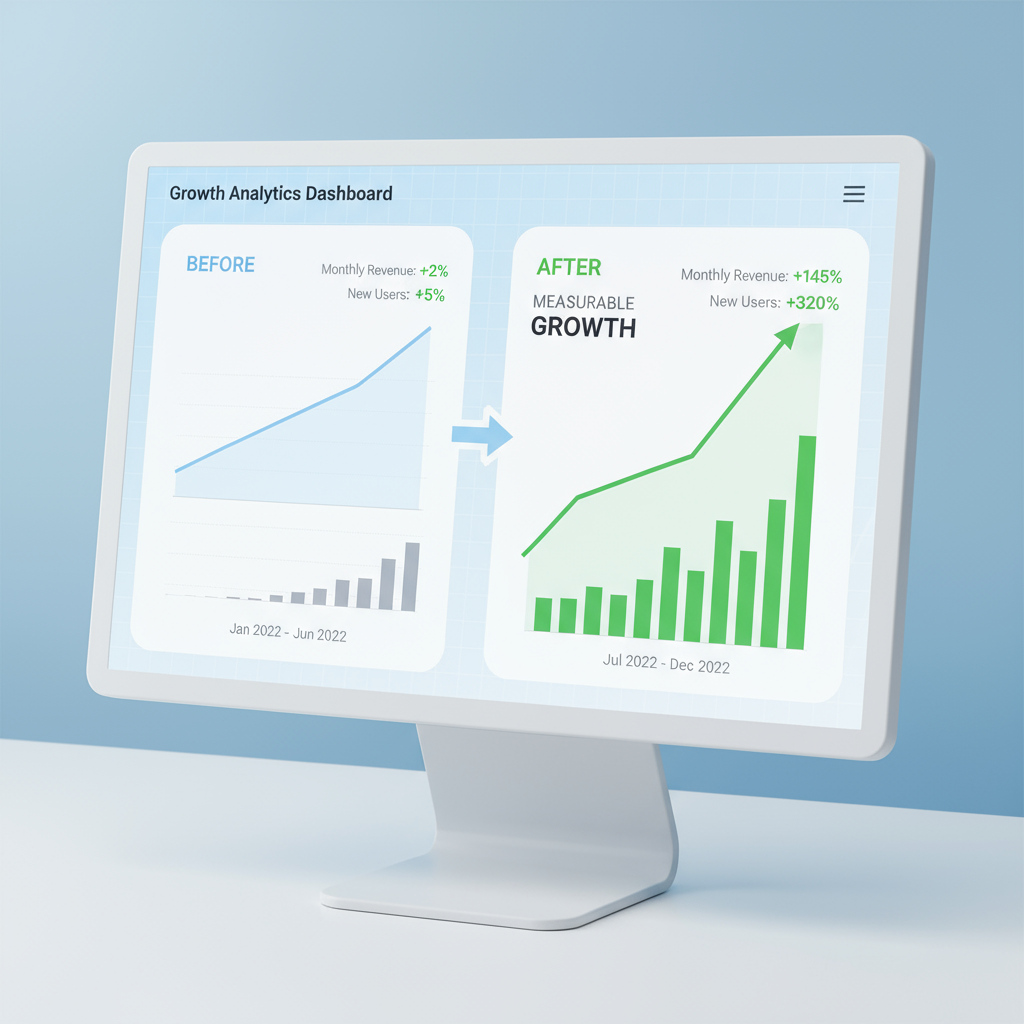
Twitter is more than just a fast-paced social media platform—it can be a powerful tool for audience growth when you understand how to interpret Twitter account analytics. By monitoring your metrics, you gain valuable insights into tweet performance, audience engagement, and growth opportunities.
For brands, creators, and marketers, analytics transforms guesswork into actionable strategy. With the right data, you can:
- Discover which content performs best.
- Understand your audience’s behavior and preferences.
- Optimize posting times for higher engagement.
- Track progress toward marketing objectives.
Regularly analyzing and applying these insights ensures measurable growth and improved ROI for your Twitter presence.

---
How to Access Native Twitter Analytics
Twitter provides a built-in analytics dashboard that is free for all accounts. Here's how to access it:
- Log in to your Twitter account.
- Click your profile icon in the top-right corner on desktop.
- Choose Analytics from the drop-down menu.
- (Or visit `https://analytics.twitter.com` directly).
- You’ll see the Account Home view, which includes stats from the past 28 days.
From here, you can explore:
- Tweet Activity – Detailed performance per tweet.
- Audience Insights – Demographics and interests.
- Video Analytics – Metrics specific to video content.

---
Understanding Key Twitter Metrics
Before acting on your analytics, it’s vital to understand what each metric means.
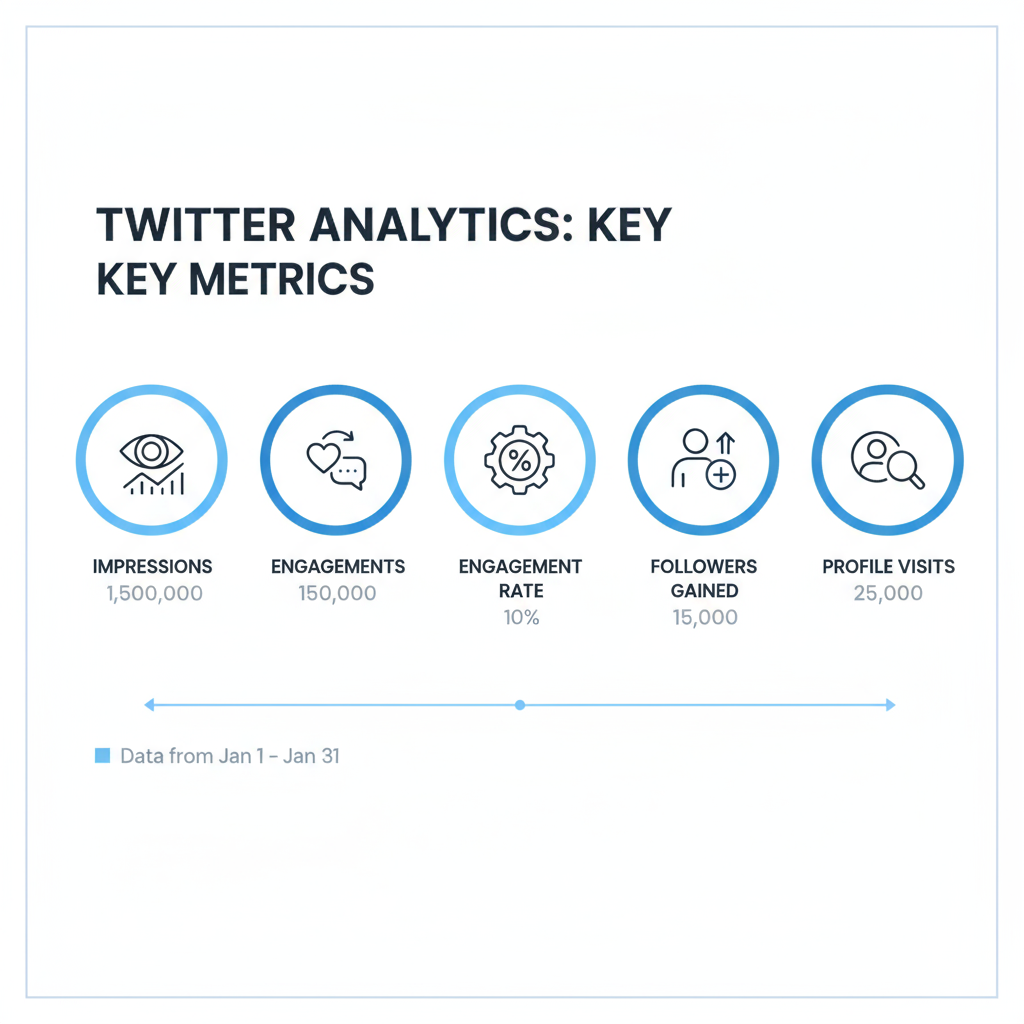
1. Impressions
The total times users saw your tweet on Twitter. High impressions suggest broad reach.
2. Engagements
Combined count of all interactions such as likes, retweets, replies, link clicks, and media views.
3. Engagement Rate
The ratio of engagements to impressions—an indicator of how compelling your content is.
4. Followers Gained
The number of new followers acquired during a given period.
5. Profile Visits
The number of times people visited your profile, useful for tracking interest beyond single tweets.
---
Analyzing Tweet Performance
Evaluating your top-performing tweets helps develop a winning content formula. Focus on posts with high engagement rates, not only high impressions.
Ask yourself:
- Which topics or formats spark the most interaction?
- Do tweets with visuals perform better than text-only updates?
- Does your audience respond more to humor, expertise, or storytelling?
Use the Tweet Activity tab filters to sort posts by performance metrics. Save top-performing examples for inspiration and replication.
---
Tracking Follower Growth and Demographics
Monitoring audience changes helps guide your content strategy. Native analytics shows:
- Follower growth over time
- Gender, location, and interest breakdowns
- Device usage trends
Export this data via CSV for detailed analysis. Tracking month-over-month changes in audience composition can refine your messaging and posting approach.
| Metric | Purpose | How to Use |
|---|---|---|
| Follower Count | Identify growth trends | Match spikes to campaigns or events |
| Location Data | Spot geographic reach | Adjust timing for key regions |
| Interest Data | Gauge content relevance | Focus on topics that resonate most |
---
Identifying Engagement Trends and Best Posting Times
Spotting when your audience is most active boosts visibility. Look at:
- Hour-by-hour engagement rates
- Day-of-week variations
- Seasonal or event-driven spikes
Post during periods with historically higher engagement. Combine these findings with analysis of content type performance to maximize reach.
---
Comparing Native Analytics vs. Third-Party Tools
While native Twitter analytics offers accurate baseline data, it can be limited. Third-party tools like Sprout Social, Hootsuite, or Buffer allow:
Advantages:
- Multi-platform performance insights
- Automated scheduling
- Custom, branded reports
Drawbacks:
- Recurring subscription fees
- Possible sync delays
- Less granular raw data access
Pro tip: Use native analytics for accuracy and third-party tools for advanced reporting or multi-channel management.
---
Setting Data-Driven Goals and KPIs
Clear goals ensure your analytics work is purposeful. Apply the SMART framework—Specific, Measurable, Achievable, Relevant, and Time-bound.
Sample KPIs:
- Raise engagement rate from 3% to 5% in three months.
- Grow followers by 20% within six months.
- Achieve an average of 1,000 impressions per tweet by next quarter.
Tracking these KPIs keeps focus on meaningful results, not vanity metrics.
---
Creating a Monthly Analytics Report
Reports help you and stakeholders see progress quickly. Include:
- Overview: Tweets, impressions, engagement rates.
- Top Tweets: Metrics with content details.
- Follower Growth: Graph month-over-month.
- Audience Insights: Demographic snapshot.
- Recommended Actions: Adjustments for upcoming months.
A consistent reporting system—whether in a spreadsheet or Google Data Studio—ensures ongoing optimization.
---
Applying Insights to Improve Strategy
Data is only as valuable as the changes it inspires. Regularly review your results to refine:
- Content formats (video, polls, infographics)
- Posting schedule
- Hashtag usage
- Collaboration strategies
Incremental, data-backed changes can compound into substantial growth over time.
---
Common Analytics Mistakes to Avoid
Avoid these pitfalls when using Twitter analytics:
- Relying solely on impressions instead of engagement quality.
- Misinterpreting anomalies without context.
- Ignoring negative signals like unfollows or critical replies.
- Pursuing vanity metrics disconnected from business goals.
Balanced interpretation is key to making analytics work for your growth objectives.
---
Conclusion and Next Steps
Leveraging Twitter account analytics requires consistent monitoring and action:
- Log in to the native analytics dashboard now.
- Evaluate the past 28 days’ performance.
- Define clear, measurable KPIs for the next quarter.
- Adjust your content and schedule based on trends.
- Keep monthly reports to track long-term impact.
By integrating analytics into your content planning, you’ll transform your Twitter presence from reactive to strategic—gaining both reach and engagement in the process. Start today and watch your measurable growth unfold.