Mastering Twitter Analytics: Strategies to Boost Engagement
Learn to use Twitter Analytics to track the right metrics, analyze audience demographics, optimize content timing and formats, and measure ROI for engagement.

Mastering Twitter Analytics: Strategies to Boost Engagement
Twitter Analytics (or X Analytics) is essential for anyone serious about growing an audience and boosting engagement on the platform. By transforming raw data into actionable insights, it lets you understand what resonates, when to post, and how to optimize each Tweet for better performance. Whether you’re running a brand account or building your personal profile, effective use of Twitter Analytics is the difference between guesswork and a scalable growth strategy.
This comprehensive guide covers everything from navigating the analytics dashboard to understanding core metrics, analyzing follower demographics, optimizing content formats, tracking ROI, and integrating data with other tools. You’ll find actionable tips, real-world examples, workflow suggestions, and a sample Python snippet for quick data analysis.
---
Accessing and Navigating Twitter Analytics Dashboard
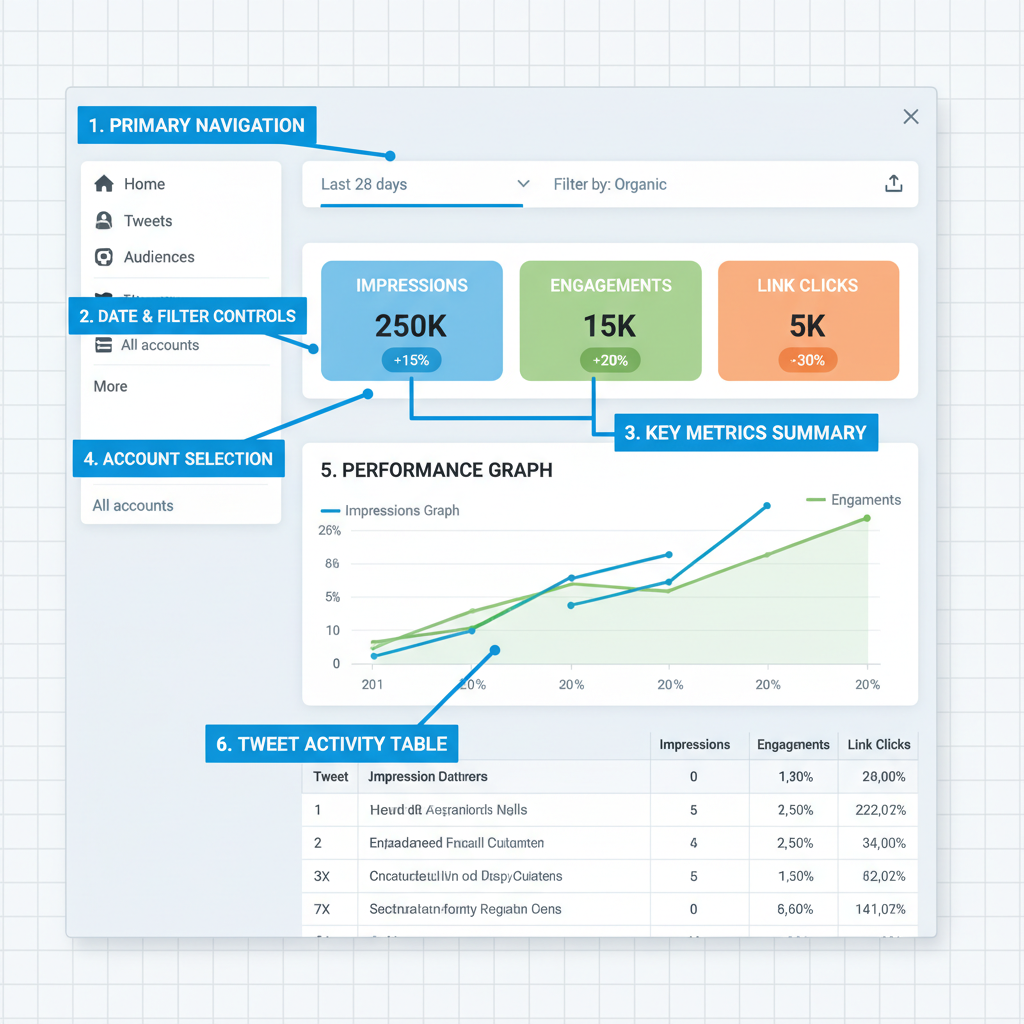
Twitter/X analytics tools provide a variety of modules, with availability depending on account type, ads access, and subscription level. Core metrics for Tweets and audience data are accessible to most users.
Getting started:
- On desktop, click “View Tweet activity” on any posted Tweet to see impressions, engagements, and engagement rate.
- From your profile menu, access “Analytics” or “Creator tools” for broader insights like top posts and audience demographics.
- In Ads Manager, explore deeper campaign analytics, conversion reporting (when configured), and data export options.
- Use the “Export data” or download icon in Tweet Activity or Ads dashboards to analyze at scale.
Navigation highlights:
- Tweet Activity: Review per-Tweet metrics, sort by date, and identify top performers.
- Audience Insights: Examine follower location, language, devices, interests, and more.
- Video Analytics: Review retention graphs, quartiles, and completion rates for video content.
- Events/Trends: Use trending topics and event calendars for timely post alignment.
> Availability and module names may change. If you don’t see a feature, consult Twitter/X help resources or subscription details.
---
Key Metrics to Track for Audience Growth and Engagement
Focus on metrics that truly inform decisions—avoid vanity numbers. Your core signals include:
- Impressions – Total times your Tweet appeared.
- Reach – Unique viewers of your Tweet (may be estimated).
- Engagements – Total interactions: clicks, likes, replies, reposts, profile clicks, etc.
- Engagement Rate – Percentage of impressions that resulted in engagement.
- Link Clicks – Click-throughs to embedded URLs.
- Follows – New followers gained from a Tweet.
- Video Views / Watch Time – Vital for media-focused accounts.
- Profile Visits – User curiosity about your brand or profile.
- Bookmarks / Shares – Indicators of value and shareability.
- Cost Metrics (ads) – CPC, CPM, CPA, ROAS.
| Metric | What It Tells You | Typical Goal | Move the Needle By |
|---|---|---|---|
| Impressions | Visibility volume | Grow reach | Post timely content, use relevant hashtags, collaborate with creators |
| Engagements | Interaction depth | Boost interactivity | Ask questions, add polls, stronger hooks, reply quickly to comments |
| Engagement Rate | Content resonance quality | Improve effectiveness | Sharpen headlines, use media (images/video), reduce fluff |
| Link Clicks | Traffic and intent | Drive website actions | Clear CTA, benefits-first copy, compelling previews, UTM tagging |
| Follows | Audience growth | Build community | Consistent value, highlight follow incentives, pin best Tweet |
| Video Views/Watch Time | Media performance | Increase retention | Front-load value in first 3 seconds, captions, portrait-friendly framing |
| Profile Visits | Brand interest | Improve conversion | Optimize bio, banner, link-in-bio, pinned Tweet; clarify positioning |

> Pro tip: Choose a single “North Star” metric aligned with your primary objective, such as newsletter sign-ups or trial activations.
---
Understanding Impressions, Reach, and Engagement Rate
Core definitions:
- Impressions – Every time your Tweet is displayed.
- Reach – Unique viewers; not always directly available.
- Engagement Rate – Engagements ÷ Impressions × 100.
Example interpretations:
- High impressions + low engagement → Improve hooks, visuals, CTAs.
- Low impressions + high engagement → Focus on scale: timing, hashtags, replies.
- High reach + high engagement → Double down on formats and timing that worked.
Common pitfalls:
- Chasing reach without relevant quality.
- Comparing raw engagement counts with unequal impressions.
- Ignoring engagement type mix (e.g., clicks vs. controversy).
---
Analyzing Follower Demographics and Behavior
Key insights to gather:
- Geography / Time Zones: Optimize posting schedule, consider multilingual posts.
- Device Use: Mobile-first design for high phone usage.
- Interests: Align topics with top audience interest clusters.
- Language / Locale: Localize terms and cultural references.
- Growth Sources: Identify which content or mentions generated spikes.
Segmentation ideas:
- New vs. long-term followers.
- Creators vs. buyers.
- Power users vs. casual scrollers.
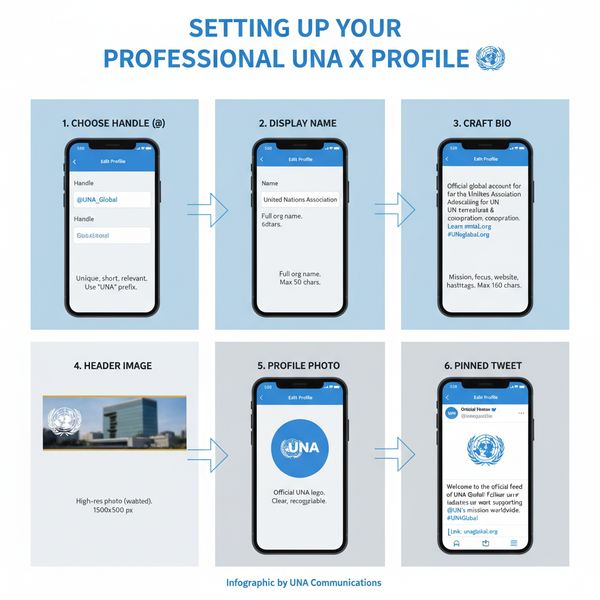
Use this data to refine profile elements—bio, banner, pinned Tweet—so they instantly communicate value.
---
Evaluating Tweet Performance and Content Optimization
The optimization cycle: Hypothesize → Publish → Measure → Iterate.
Checklist:
- Hook strength in the first line.
- Variety in format (threads, polls, media).
- Eye-catching visuals with captions.
- Clear calls-to-action.
- Topic fit based on analytics.
- Readability and structure.
- Social proof where relevant.
A/B testing examples:
- Hook variations.
- Media vs. no media posts.
- Thread vs. single Tweet.
- Explicit vs. implicit CTAs.
Python snippet for Tweet data analysis:
import pandas as pd

## Load exported Twitter analytics CSV

df = pd.read_csv("tweet_activity_metrics.csv")

## Calculate basic rates

df["engagement_rate"] = df["engagements"] / df["impressions"]
df["ctr"] = df["link_clicks"] / df["impressions"]

## Tag content types

df["has_image"] = df["media_type"].str.contains("image", case=False, na=False)
df["has_video"] = df["media_type"].str.contains("video", case=False, na=False)
df["has_link"] = df["url_count"] > 0

## Group and sort

summary = df.groupby(["has_image", "has_video", "has_link"])[
    ["impressions", "engagements", "engagement_rate", "ctr"]
].mean().reset_index()

print(summary.sort_values("engagement_rate", ascending=False))
---
Using Twitter Analytics for Campaign Tracking and ROI Measurement
Steps to track ROI:
- Define off-platform goals (sign-ups, purchases, etc.).
- Use UTM parameters on every link.
- Track in web analytics (e.g., GA4) and set conversions.
- For ads, configure conversion pixels and events.
ROI formula:
ROI (%) = \[(Revenue from Twitter – Cost) ÷ Cost\] × 100
| Objective | On-Twitter KPI | Off-Site KPI | Notes |
|---|---|---|---|
| Brand Awareness | Impressions, share of voice | Branded search lift | Track topic associations |
| Traffic | Link clicks, CTR | Sessions, engaged sessions | Ensure UTM consistency |
| Lead Gen | Follows, profile visits | Form fills, MQLs | Use lead magnets, pinned content |
| Sales | Replies/DMs with purchase intent | Purchases, revenue | Attribute with appropriate models |
| Community | Replies, bookmarks | Newsletter or forum joins | Host recurring Q&As |
---
Leveraging Insights to Refine Posting Frequency and Timing
- Map engagement by hour/day to find ideal posting windows.
- Start with 1–2 quality posts daily; adjust based on performance.
- Monitor for engagement fatigue.
- Stagger formats to maintain novelty.
- Engage via replies to reach new audiences.
Test approach:
- Weeks 1–2: 1 post/day.
- Weeks 3–4: 2 posts/day.
- Compare average engagement per post.
---
Integrating Twitter Analytics with Other Social Media Tools
Recommended integrations:
- GA4 for traffic/conversion attribution.
- Looker Studio / Power BI for dashboards.
- Tools like Buffer, Hootsuite for scheduling and aggregate analytics.
- CRM systems (HubSpot, Salesforce) for lead/revenue tracking.
- Zapier/Make for lightweight reporting automation.
Governance:
- Standardize UTMs.
- Document metric definitions.
- Use official APIs and exports.
---
Common Mistakes to Avoid and Best Practices
Avoid:
- Tracking too many metrics without purpose.
- Ignoring comparative benchmarks.
- Over-chasing viral content.
- Skipping UTM tagging.
- Rarely reviewing performance.
- Failing to engage with your audience.
Best practice tips:
- Use 3–5 content pillars tied to business goals.
- Maintain a swipe file of top performers for repurposing.
- Pin high-conversion Tweets.
- Use media strategically.
- Set monthly learning objectives.
- Share analytics insights across your team.
---
Conclusion
Twitter Analytics is more than numbers—it’s your system for growth. By focusing on key metrics, optimizing content formats, tracking ROI with UTMs, and refining timing, you can turn sporadic wins into sustainable momentum. Apply the workflows, tests, and integrations in this guide, and review results regularly.
Start now: log into your analytics dashboard, pick one key insight, and run a small test this week. Iteration is where the real engagement boost happens.